


This week's analysis focuses on the US dollar Index, Gold BUGS (HUI) Index and the S&P 500 index. Currently there are numerous opinions (as this editorial) for the current market direction. The patterns emerging are very complex, and subject to the current patterns in place with news to further move markets. The two chart types present include
1) Daily and weekly charts showing Bollinger bands and stochastics set to each index, with red lines marking market bottoms and green lines marking market tops.
2) Elliott Wave analysis of shorter term and longer term counts.
Personal experience has shown that it is very difficult to perform an accurate Elliott Wave count without gauged against some other indicator. It is best for an individual to become proficient at 6-8 indicators rather that 100 (i.e. A Western gunslinger had their best shots with pistols they were used to firing a lot).
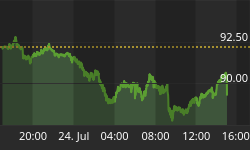
US Dollar Index
The first two charts show the weekly and daily US dollar Index with BB's and stochastics. The BB's on the weekly chart show some time is required for a period of stabilization in the volatility. Note the weekly stochastics stayed oversold for years, with a slight slanting indicating a two-year market top soon to be in place. The current stochastic lines %K (fast and in blue) is still under the %D (slow and in green), indicating more downside prior to a significant bounce in the US dollar Index. The daily stochastics have a triangular trendline formation, with the %K and %D approximately 1 1/2 to 2 months away from crossing over giving a sell signal.


The next two charts show the Elliott Wave analysis of the US dollar Index for longer and shorter term. The first chart is the longer-term count showing the two possible directions the pattern may travel. The USD pattern is somewhat difficult to determine given the complexity……but the green in the preferred count for the direction. The index has rallied for one month straight with no breather……a correction of this is coming…but as stated before, the USD trading range is 92.5 to 96.5 over the next two months. A move to slightly above 97.0 would represent a 61.8% retracement of the move. The second chart shows the shorter-term count, with the only count possible right now showing one more leg up…to what height will be determined. A break of 94.9 would confirm the pattern of wave [a] of minute degree was complete and the pattern would be retraced. The USD could very well move higher, but based on examination of the HUI and S&P and their trends, the range of 92.5 to 96.5 stands until proven otherwise.


Gold BUGS Index (HUI)
The first two charts show the weekly and daily HUI Index with BB's and stochastics. The weekly pattern has BB's getting set for another move upward, confirmed with the stochastics beneath. The daily chart shows the HUI has the lower BB's moving upward with a 4-6 month period before they confirm a shift in the trend of the index. The stochastics beneath are still bullish with many months away from a sell signal.


The next two charts show the longer and shorter term Elliott Wave patterns. There are numerous alternative counts, which is indicative of the current move up being one third to half way (since near the end of April). How the pattern moves will have important implications on future price patterns. The move up is either corrective or impulsive. As corrective waves (zigzags) have a 5-3-5 pattern……the pattern here has that with wave (C ) not being overly extended compared to (A) (this would imply an impulsive wave). The corrective move is an alternate count, which has 2-4 possibilities. The preferred count is shown in color. Again….there are 2-4 possibilities here….all point up, but just what unfolds has yet to be revealed The preferred #1 is that we follow the course of the green line….further lows then we break above 160 maintaining the impulsive count since early April. Next alternate count is that we go down according to the purple line and then move up. Third…we go down to 135ish, to make that wave E of a large running triangle since last year (wave E.(4)) with wave (5) to follow »» This has upside to 240-300 on this index. The running triangle could also be wave (E).[X]. with [Y] to follow (a three wave pattern. Corrective or impulsive etc etc. The bottom line is that the HUI is moving much higher during the coming 4-6 months. IT IS IMPORTANT TO NOTE THAT THIS HIGH WILL BE A TOP OF A HIGHER DEGREE WITH A POSSIBLE 1-2 year SIDEWAYS MOVEMENT. This would follow a turn in the USD index staging a 1-2 year correction from the decline since a high of 120. The second EW chart shows the pattern since late March, with further probabilities of a lower degree. Multiple probabilities indicate this wave is between one third to half way complete with respect to time. There will be a lot of possible routes for playing the market at this point in time.


S&P 500 Index
The first chart shows the daily S&P 500 Index with BB's and stochastics. The stochastics gave a sell signal a few weeks ago….but the lines are still dancing with each other, albeit bearish. The lower BB's suggest one to one and a half months before we can expect to see a termination of the wave up. The sell signals in this chart have been quite precise, so late August is the expected completion of this wave patterns exhaustion.

The next two charts show the longer and shorter term Elliott Wave counts. The labeling for the move down since July 2001 is a corrective pattern. 1020 (up to 1035) is the line in the sand, and this area represents a 61.8% retracement of the move since wave (C ).[X]. The second chart shows the wave pattern since the low place in March 2003. This pattern on the lower time scale is purely corrective. Last week I had the move down labeled as heading down to 910-920…but we bounced. The impulsive moves turned out to form a zigzag (5-3-5). The move up was a three wave affair, and it is highly anticipated (over 90% probability) that we are going to have an impulsive wave down in wave c to complete a flat. The low of 910-920 is not expected to be put in for 2-3 weeks from now. So far the lower trendline has not been pierced. How the wave pattern here develops will be market driven……910-920 should be the ranges of the low, with a move all the way back up to 1020ish before heading down. What will the next leg down hold in store?? We either go to 800-840 and then really rally back hard (1200-1500 probable) or go down to 600ish. WHATEVER SCENERIO EMERGES, THIS WILL BE A SIGNIFICANT BOTTOM, AND A LARGE RALLY WILL OCCUR AFTERWARDS. This is looking to be like a 6-month decline, so a bottom in February to March 2004 is looking like the target for completion.


Summary
The above charts show the USD is set to go sideways between 92.5 to 96.5 for the next 2 months. The HUI is probably going to go sideways until the end of August but a very very powerful move lies ahead with a target in the range of 240-300 by December 2003 (maybe January 2004). After this top is put in, a sideways to downward movement lies ahead for a 6-12 month period. The S&P 500 Index should put a top in around the end of August and decline into February/March 2004. A 6-12 month rally (to follow the Presidential Cycle) will help feed this rally. This will stand to be a very powerful rally possibly with the S&P going up to 1500 (If we do not decline below 800, otherwise a decline to 600 would imply a rally back up to 1000ish) and then back down to place a very very significant low by 2006-2008. The pattern developing is either going to be a very complex triangle of a larger degree or a flat (we would still be in wave a of cycle degree).
The market is not based upon reason, fundamentals or logic. It is an illogical beast governed by psychology, specifically greed and fear. Sentiment indicators help to gauge this somewhat, and Elliott Wave patterns quantify market behavior with a strict set of rules which will accurately determine future market movements if the labeling is right for higher degrees (lower degrees can always have many opinions). All of the chart analysis was done on Saturday, and just glancing at the US dollar Index, it is at 96.11 with gold up 0.10 cents. The HUI/USD ratio chart has a high degree of correlation with the HUI price movement to the US dollar. A sell signal has not been placed in this chart…..which is why I think the USD is range-bound for the price and period of time mentioned above. The HUI also has an upward sloping stochastic pattern (not mentioned earlier) which is further suggestive of bullish actions to come. The XOI and XNG were covered last week. Both are in multi-month corrective patterns, so will not be covered until a later date. Have a good week.


