


Introduction
This editorial will examine the Elliott wave patterns, Bollinger bands and stochastics of the US dollar Index, Gold BUGS Index and the S&P 500. Before we get into the technical analysis there has definitely been a lot of excitement in the gold community the past week. Gold generally moves in the opposite direction of the US dollar and the major US stock indices. If we are in a gold bull market, this idea implies weakness in the US markets and its currency.
Bollinger bands on all charts have the setting 21 (red), 34 (blue), and 55 (green). Fibonacci numbers and sequences tend to give important support and time lines in the marketplace, which makes them so commonly, used.
A lot of negative use has numbed most people...layoffs here, pension fund deficits etc. The more and more I think of the markets, the eventual bottom could not be put in until later in this decade. There is so much debt that the Fed will very slowly try to steer its way out of this. Can one imagine if the Fed inflated the USD reserves to near 44 trillion required to meet future debt obligations from retiree's etc.?? I have no data to show the total amount of US dollars in circulation, but one could imagine that expansion to the above level would have negative repercussions on the value of a dollar and be very bullish for gold. Inflation adjusted, the price of gold would have to go to $3000 to match the $800 level in 1980 money. The Fed increasing the money supply is inflation by nature…but if more money is leaving the system than is entering, that is deflationary. What the FED is doing could be inflationary in the short term or even hyperinflationary, but in either case, deflation will eventually settle in. I do not see gold going down to $200 at this point at all. I did think that gold would go to $270 earlier, but the wave structure did not confirm that so I went bullish. There is just too much demand coupled with reduced mining that makes this unlikely The amount of debt out there may make dollars valuable, but if defaults are going to be huge, the only people really in need of dollars will be institutions loaning out money since they will own virtually everything. The Fed has been considering taxing money sitting idle in bank accounts to keep the velocity of money in action. One way to avoid this is to invest in gold shares or stocks and hold them. It is out of circulation and out of government's reach. A race to gold lies ahead for most countries, which will require prudent investing. Mines in very unstable countries could be taken over when gold goes north of $1000/ounce and may make a switch to pure gold prudent. I am unsure how things would develop at this juncture, but companies in the US or Canada with the majority of their mines in North America would be a safer play. I could go on and on, but it is the same information out there day after day. Time for a look at the market technicals…
US Dollar Index
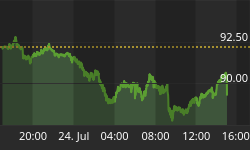
The first chart shows the daily chart with Bollinger bands (BB) and stochastics (55,21,34 setting). The stochastics have a triangular channel sloping down, with the end portion having lines drawn in to mimic what is thought will happen. Whenever the upper BB's are apart, they touch each other for awhile before continuing their move. A trendline was drawn with a flat line to converge the slower BB with the faster. This gave approximately one to two more months of the US dollar Index in a trading range of 92.5 to 97 cents. After the US dollar index bottoms on this next descent there will be a strong rally and lightening up on gold stocks may want to be considered at that juncture (Decemberish of 2003).

The next two charts show the longer and shorter-term wave counts of the US dollar Index. I have introduced an alternative count that is possible. The USD after this next decline is likely to embark on a 8-12 month rally of the entire move down since March 2002…not nearly enough time to complete the drop I have anticipated. Time will tell how the larger degree count gets assembled. The move up has run into Fib resistance at 61.8% of wave 1's decline coupled with prior resistance of 5.(1) (orange line). The shorter-term count was also analyzed three days ago, and the pattern has moved to ~95.1 overnight….somewhere between 38.2% to 50% retracement of wave (y). There is likely more downside to somewhere between 94 to 94.5, pending how this pattern plays out. It is likely the USD will be stuck in a narrow trading range defined by the price range of wave (y).


Gold BUGS Index (HUI)
The first chart shows the EOD data for the HUI with Bollinger bands and stochastics. One sell signal that will be suggestive to the end of this run will be the bottom 21 day BB crossing underneath the bottom 34 day BB. The upper BB's should come apart after their run signaling the termination of the run also. The stochastics crossing over should signal the termination of the move up prior to further consolidation. The stochastics have a long running ascending support for the lower trendline

The next two charts show longer and short term Elliott Wave counts. The wave structure up is either corrective or impulsive (most likely impulsive). If it is corrective it will be a double zigzag structure. The long consolidation period makes this possibility less likely. The move up since the end of March is impulsive which dropped the alternate count of it being corrective for wave D. If this was a running triangle we are still in, it is very bullish. A move to beyond 170 would virtually eliminate the probability of the running triangle scenario. The second chart shows the wave count since April. The labeling for wave [v] sub-structures is on shaky ground due to the possibility of the entire move being complete. We had a four-week consolidation, sot his next leg is likely to be a strong move to 180-190 before a pullback. I will evaluate is the sell signals warrant attention later on. Comparisons between the HUI and USD index will be important for everyone to follow. After the USD tops out in 1-2 months in its corrective pattern somewhere in the range of 92.5 to 97 cents, it will embark on a 3-4 month decline putting in a significant bottom. At this point, there exists the chance of a retracement to 100 to 105, which would trash gold should it occur, so food for thought. The next 3-4 months for gold and gold stocks look very positive and thoughts of selling are in the distant but near horizon.


S&P 500 Index
The stochastics on the S&P 500 index gave a sell signal nearly 3 weeks ago. Due to the time frames of the stochastics I chose to use, a crossover will not nail the top, and may even be more than 7-8% from the top….but profits are locked in when it occurs. BB's producing a ribbon-type pattern gives very important information. They are pointing to the S&P staying in the current range above 900 until late August to early September. Although the sell signal was given with the stochastics, it is unlikely that much upside if any exists.

The second chart shows the Elliott wave pattern of the wave structure since March 10, 2003. The indices should be up today for the next while. The preferred count has the green line for the thought pattern that will emerge the next while. Corrective patterns are very difficult to label due to impulsive and corrective waves being pieced together to build larger corrective patterns. There is a chance for 10-15 points upside the next few days, but a decline is expected to occur after. Should be go up to 1015 again and fail to pierce 1020 the index can expect a very sharp decline down to the 900-910 area. Being long or short for the S&P for most people at this juncture is a non-profitable experience due to the whipsawing and very narrow spreads between the waves. When the lower BB's come together prior to the decline sometime in late August to early September, that will be the time to short the index profitably. Come February to March 2004, a significant bottom of some sort will be in place with the following possibilities…
We only drop to 800-820 with a potential rally afterward up to 1200-1500 (I put 1200 as the maximum upside but in these markets anything can happen.)
A drop to 600, with a rally up to 1100 to 1200.
The Presidential cycle is in 2004, and the USD will also be putting in a significant bottom. It is important to note that both are in a bear market still and this will just be another bear market rally. A switch to the tech stocks etc. at this point may require a nose plug, but could be profitable.

Summary
The USD has 1-2 months of more sideways movement prior to heading down on a final leg to put in an intermediate bottom sometime in December - January 2004. A rally will follow lasting 8-12 months. This in turn will have a negative impact on gold and gold stocks when this does occur.
The HUI is still on a bull run, with no indication of a sell signal for 3-4 months down the road. At that juncture, examination of daily and weekly charts, with various time frame settings and other indicators will be crucial to give the proper time to sell. Gold stocks are going to be the only show in town for the next while. The XOI and XNG are still in corrective phases lasting another 4-6 months (possibly a longer consolidation period coming up).
The S&P has another 1-2 months-sideways action prior to a decline. Difficult to make money here going long or short, as the moves is not very much between the waves. Earnings season is underway, and not pushing the index above 1015 will be bearish. The stochastics indicate a loss of momentum, with the BB's indicating a further 1-2 months of consolidation prior to the next leg down in the markets. Very very oversold markets here with no sellers. Once the fall season starts, we could expect a nasty decline.
I am going on holidays this week, so I will not be having an article for the next two weeks. The roadmap here is quite clear as to the general direction of the USD, HUI and S&P 500 indices. I may trade gold stocks in my trading account, but will probably leave my dividend paying stocks in my RRSP alone pending how severe the decline in the HUI looks 4-5 months from now.


