


Week of August 24th, 2007, volume 1, edition 19
(FOR SUBSCRIBERS ONLY)
The State of the Physical Commodities Markets
We are all painfully aware of the mauling that has been laid upon the equity markets and in particular the resource sector. But, what of some of the actual physical commodities that under-lie these equity markets? Let's take a deeper look at the situation.
Aluminum

Aluminum prices have been certainly hit and at present are down 15% from their May highs. But, taking a different look at the situation, we see that according to the 5 year chart, the Aluminum bull market is alive and well. Also, despite the recent 15% price drop, we see that the amount of inventory on hand has not changed. Hence, the price drop is fear related and not fundamental.
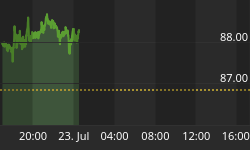
Lead

Lead prices have also been hit and at present are down about 14% from their July highs. But, again, if we take a different look at the situation, we see that according to the 5 year chart, the Lead bull market is alive and well. Also, despite the recent price drop, we see that the amount of inventory on hand is trending down. Lead -as boring as it may sound, is signaling an opportunity for investors and traders alike.
Zinc

Zinc prices have also been hit and at present are down about 24% from their April highs. But, again, we see that according to the 5 year chart, the Zinc bull market is technically still in its uptrend despite having taken this hit. From January 2005 to January 2007, Zinc prices rose a net $1.50 per pound. If I pit my Fibonnacci hat on, I would be comfortable even seeing a drop to $1.25 per pound as part of an ongoing bull market. And the inventories are again telling us something here. The amount of inventory on hand is trending down. Zinc -is signaling an opportunity for both investors and traders alike.
Nickel

Every story has a chapter that proves a difficult read. In the commodity bull market story, Nickel is proving to be the problem child. Nickel prices have been "smoked" to put it bluntly. Prices since May have retreated a good 50%. The reasoning for all this appears to be fundamental. Nickel inventories have taken a big jump to the upside since June. So, is this cause for concern? Let's have a look at the longer term inventory picture.

After hitting all time record lows in early 2007, inventories have now just only recovered to where they were in January 2005. So, it's not like the world has suddenly quit using the stuff and warehouses are suddenly overflowing with it. The world is NOT about to stop using Nickel. I would say from here we will see the inventories level out and Nickel prices resume their upward momentum.
Copper

Copper has had a pullback of late - some 13% or so. But the 5 year chart tells us the Copper bull market is alive and well. The Copper inventories also support this, having had a good pullback in recent months.
Longer term, we also see that Copper inventories remain under pressure. In past newsletters, you have heard me say that Copper is the metal with a PhD degree in Economics. Copper is used in a multitude of consumer items today and the notion that inventories remain under pressure tells me that the global economy is moving down the tracks at a good clip pulled by the engines of Asia and India.

Oil
The following chart shows the amount of Crude available in the US to refineries on a daily basis.

What we see is that the amount available really has not increased. Each and every day, the US must import around 10 million barrels of Oil to supplement daily domestic output of 5 million barrels. Oil consumption shows no sign of backing off. And with such a heavy dependence on other nations for Oil, I seriously cannot see that the ongoing bull market for Oil is going to stall out. Then there is the China factor and the Indian factor. These nations are ramping up their Oil usages as well. The days of cheap Oil are over.
So, there you have it. The Commodity Supercycle is in fine shape and investors need to remember this. Equity markets however will remain volatile as Captain Bernanke tries to navigate the ship through the choppy, murky, sub-prime mortgage waters. Markets have rallied off their recent lows quite nicely. But, I would not at all be shocked to see a re-test of these recent lows in September - which by the way has a reputation as being the nastiest month of the year on the equity markets. Shorter term trading thus remains my preferred approach right now.
I will conclude this week's report with a look at a few more trading candidates.

Teck Cominco is the grand-daddy of Canadian mining companies with interests in Lead, Zinc, Coal and so on. We are approaching a moment of decision here. Will price advance enough to push RSI over "50"? Will price advance enough to take out the 50 day moving average? The next several days are critical for those with a longer term view. If we can hurdle these key barriers, Teck may be in for a further run. For shorter term traders, use a 30 minute chart or even a 15 minute chart. My preferred technique is to watch price action and as it crosses up and through the 18 period moving average, you would BUY. Look to sell when RSI approaches "65" or so. Remember, if short term trading something like a Teck Cominco, use at least 400 shares and don't get greedy on the small moves. If you can bag a couple hundred dollars on each trade, take it. Be sure to do some back-testing of this method so you are comfortable with it before you plunge in.

In my comments above, I said Lead was offering investors an opportunity. There are not a lot of stand alone Lead companies and Ivernia is one that comes to mind. However, this one is a bit tricky right now. Early in 2007, some birds turned up dead at Ivernia's Lead Mine in Western Australia. Aussie authorities moved swiftly and today Ivernia sits with its mine idle. However, it is working on a more environmentally palatable solution for shipping its Lead concentrates to port. When the mine re-opens and I am sure it will, expect to see Ivernia get back on track quickly. And how am I so sure it will open? Well, for starters, 2 Canadian investment houses just did a bought deal at C$1.65 a share. They would have steered clear of Ivernia if there was no prospect for re-opening the mine. If you are seeking to buy, wait for dips to C$1.10 or so.

Selkirk Metals is a Canadian junior that is sitting on a lucrative Zinc deposit in British Columbia. In a nutshell, here is what Selkirk is all about:
- Property is 100 kms NW of Revelstoke, BC in the Kamloops - Revelstoke mining district.
- To date 12 zones of Zinc mineralization have been found with a strike length of 5.4 kms
- A road will be further advanced this year towards the area where an adit will be advanced into the mountain.
- Adit will extend into the mountain up to 1 km. This will allow for some bulk sampling.
- Drilling is ongoing and objective is to further refine depth and strike of these zones of mineralization.
- Selkirk owns 100% of the project.
I noted above that the Zinc market was looking good yet. The trend on Selkirk is still to the upside. A strategy of buying the dips remains the favorite. Obviously shorter term traders would play the swings. Should price action get above and stay firmly above the 50 day moving average, we could see a re-test of old highs.

Savanna Energy Services is a leading energy service firm in Alberta. Generally, Q2 is the worst month for any energy service firm and share price can often decline on the back of (or in anticipation of ) poor Q2 earnings. A quick glance at the chart above shows this to be the case for Savanna. Definitely some good support exists at the $17 area. From here, I would say that price action will form a basing pattern before moving higher in the latter part of 2007. Traders - this one is for you. Use the 30 minute charts (or shorter durations if you wish). For those of you seeking something a bit longer, I would maybe wait to see what September has to offer up on these markets. Look for buying opportunities on the back of a spate of weakness ( ie a day when markets are rattled by more sub-prime fears). Seek to sell into the first meaningful rally that comes your way.

GLR Resources is a fascinating story. In a nutshell, here it is:
-
GLR has property interests all across Canada. Its flagship project is the Goldfields Project situated in northern Saskatchewan, Canada.
-
The Goldfields Project has a resource in the ground of over 1 million ounces of Gold divided between 2 open pit-able deposits called the Box deposit and the Athona deposit.
-
Final feasibility work has been done on the Box deposit. Feasibility work on the Athona is set to get underway soon.
-
The Box deposit contains the lion's share of the 1 million ounce resource. In fact, the Box deposit has 601,000 ounces that are PROVEN - ready to mine. According to the company's press release of June 22nd, the Box deposit contains a further indicated resource of 151,000 ounces. The cash cost to mine the Box deposit is $280/ounce - which in itself is an attractive figure. Data to calculate these reserves and resources is taken from drilling done to the 500 foot level. It is known for a fact that the Box deposit is open down to at least 900 feet. This means, there is more Gold in the deposit than what numbers currently show.
-
The Athona deposit has a measured and indicated resource of some 289,000 ounces of Gold and a goodly portion of this will no doubt be classified as PROVEN - ready to mine when the Athona feasibility report is made public in the next few months. The Athona deposit is also open at depth which again means there is more Gold there than what data shows.
-
Environmental permitting is progressing well and all should be in place by late October / early November. Verbal approval has been given on the permitting. Permits were supposed to be granted by end of August, but a request by GLR to expand the mine to a 5000 tonne per day operation (from 2000 tpd) resulted in authorities asking for a couple more tests done. These have now been done and all is well. I suspect this very slight delay in permitting is also rattling markets. However, I say don't worry about it. Permits will be granted.
-
Bank financing to build the mine is also in place and bankers right now are completing their final over-view of the project. Interestingly enough, these same bankers also own 12% of the outstanding shares. I am always intrigued when bankers themselves take an equity position in a project. If it's good enough for them, then for sure it is good enough for the rest of us.
-
Expected date for commencement of Gold production is early 2009.
GLR has been hammered with the flight to liquidity in Canada lately. And, understandably so. With companies like Cameco and even Shore Gold now fessing up that they bellied up to the trough like pigs and gorged themselves on sub-prime mortgage debt investments - I can well see why the Canadian resource sector is feeling queasy in the stomach.
I say, take advantage of it all. Pick up some GLR Resources here at these prices. A press release on their website says they have S&P clearance in the USA, so your broker should be able to easily help you get some.
US Dollar - An Economic Paradox

This week saw a slight easing in the US Dollar. However, with the uncertainty continuing in the sub-prime market, US Dollars remain in demand as institutions park money in the relative safety of US Treasuries.
Crude Oil - Short Term

Dean Misses the Gulf...
Hurricane Dean caught the Yucatan Peninsula in Mexico and then instead of turning and swirling into the Gulf, he fizzled out over the Mexican interior. Crude Oil traders took this as good news and the pressures on Oil prices continued to ease. From here, I would not be shocked to see Crude test its 200 day moving average. However, as I noted in my discussions earlier in this letter, Crude remains very much in a bull market. We have several more weeks left in Hurricane season as well. So, look for some interesting price action on Crude in the near future.
Natural Gas - Short Term

A Re-Test of the Lows ....and then some....
Last week I suggested very strongly that we had most likely seen the lows in Nat Gas. Well, nothing like being proven wrong!
On the notion that Hurricane Dean was not going to turn and enter the Gulf, Nat Gas dropped like a stone of off a cliff. From here - I am sure we will see higher prices. But, it looks like volatility is going to be the name of the game for the Nat Gas markets. I am keeping my eyes wide open for trading opportunities in energy service stocks and the example of Savanna Energy cited earlier in this letter is but one such company worth following. Stay tuned. The Nat Gas market will give us some excitement yet.
Gold - Short Term

Trying to Recover ...
Traders are no doubt still in a quandary. If times are tough due to the sub-prime issue, why then is Gold suffering? Is it not supposed to be the rock of stability in tough times?
Gold (basis the October Futures) continues to tread water. However, both the 30 day and 200 day moving averages are within reach now. In order for Gold to really get rolling, we need to take out these averages. My concern, though, remains one of liquidity. If another Hedge Fund hits the skids with sub-prime mortgage issues, we may see another round of selling. After all, for a Hedge Fund in trouble, Gold is a liquid asset that can easily be sold off to generate cash. Watch carefully. In the days to come, if these key averages are taken out, we will see a flury of activity in Gold stocks both big and small. Should this be the case, get set to act.
Sugar - More economic than Corn based Ethanol....

Sugar finally is shaking itself out of its doldrums. As an energy source, it is actually more economic than Corn for making ethanol. Back in June we saw Sugar make a move higher. Then news that India was sitting on a big crop caused a pullback. But now we are looking set to move higher again. RSI is close to crossing above "50", DMI is set to record a positive crossover and my favorite indicator combination, the 14 period RSI with a 10 day moving average superimposed has just recorded a buy signal. If commodities are your thing, talk to your commodity broker about opportunities in Sugar.
September Editions of the Supercycle report
I will do my level best to provide you with weekly Supercycle reports during the next month and a bit. My travels as a consultant to the resource industry will see me in the U.K. for much of September. I will do my best to keep you informed. Thanks for your patience.
Is there a particular stock you want profiled? Do you have any questions about Futures or Options? Looking for Technical opinions on a stock?
Email us at: supercyclereport@gmail.com
Meridian is a covert figure who prefers to keep a rather anonymous low profile. But despite his low profile, Meridian has big picture insight into the Commodity Supercycle the global economy is currently experiencing and solid connections to some of the most influential personalities in the Canadian energy and mineral exploration industry.
An Engineer by profession, Meridian spent many years in industry. After completing his MBA in 1999 from a recognized business school in Europe, Meridian bade farewell to industry and followed his passion to master the financial markets. He became an Investment Advisor with one of Canada's leading independent brokerage firms with a decided focus on energy and resource equities and commodities. The learning curve was steep and at times seemingly almost vertical. But Meridian was determined to succeed. And succeed he has. No more mind-numbing newspaper columnists and no more talking heads on television. After several years of pouring over piles of financial statements and studying charts and technical indicators until nearly dizzy, Meridian has refined an approach to trading and investing that involves a unique blend of both the fundamental and the technical. It is this approach and insight that Meridian now seeks to share with those who subscribe to The Supercycle Report.
Meridian recently left the brokerage industry and now consults to the resource sector and writes full time for www.themarkettraders.com.
** DISCLOSURE NOTE: The author does own GLR Resources as profiled in this week's letter. He also does some consulting to GLR. The author has owned the other stocks profiled in this letter at one or more times in the past. He continues to short-term trade these stocks and by the time you receive this letter, he may well have positions in play.


