


Below are extracts from a commentary originally posted at www.speculative-investor.com on 30th August 2007.
Current Stock Market Situation
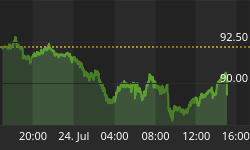
The stock market correction has been driven by problems in the financial sector, so a signal that the correction had ended would be strength in the Bank Index (BKX) in absolute terms and relative to the S&P500 Index (SPX). The sharp decline in both the BKX and the BKX/SPX ratio during the first three days of this week therefore indicates that the correction is not over.
The following chart shows the current status of the BKX and the BKX/SPX ratio. With the BKX having failed at or just below resistance at 110-112 a number of times over the past month, this resistance range is clearly significant. As a result, for our short-term bearish view to remain valid the BKX should not close above 110 and must not close above 112 at any time over the coming few weeks.

We continue to expect a sharp decline to an October low from whatever peak is made during the first half of September.
Much worse than the LTCM crisis?
We've read commentary to the effect that the current crisis is much worse than the crisis of 1998 because in the earlier episode the source of the problem was identifiable as one large hedge fund (LTCM), whereas the major problems are now so spread-out that it will be impossible for the Fed to target any corrective actions in an effective way. In other words, the thinking is that the Fed's actions were successful in 1998 because it could pinpoint the primary source of the problems, whereas in the current situation there is no readily identifiable primary source that can be targeted by the Fed.
There is some truth to such commentary, but it must be remembered that the LTCM blow-up did not CAUSE the 1998 crisis. The 1998 crisis actually began during 1997 as an Asian debt/currency crisis and subsequently spread to almost all emerging markets. It led to a debt default by Russia, the dramatic widening of credit spreads throughout the world, and, eventually, to the collapse of a hedge fund that had made highly-leveraged bets predicated upon interest-rate spreads returning to normal levels. That is, the LTCM blow-up was a late-stage ramification of the crisis; it wasn't the cause of the crisis.
Further to the above, the current crisis may not be as different to the 1998 episode as many people are claiming. The numbers are now much bigger, but big numbers don't pose a problem for the central banks. The only thing that really scares the average central banker is the risk that a critical mass of people will 'cotton on' to the fact that continually creating more money to 'solve' the economic/financial problems that arise from time to time will ultimately destroy the currency.
Who pays the debt?
An article by Bob Moriarty at http://www.321gold.com/editorials/moriarty/moriarty082907.html begins with the following statement:
"It's very important to remember that all debt gets paid. It is paid either by the borrower or by the lender but it must in the end be paid."
This statement gets to the heart of the disagreement we've always had with those who forecast deflation (a sustained contraction in the total supply of money that leads to an increase in the purchasing power of money). It is true that all debt must eventually be paid, but under the current monetary system the bulk of today's collective debt will be paid by tomorrow's inflation; that is, the debt will get paid by EVERYONE, with savers paying more than non-savers.
Of course, more inflation generally means more debt since most new money gets borrowed into existence, which is why inflation can never be more than a temporary fix. However, temporary fixes can continue to be applied for a very long time.
In our opinion, there won't be any reason to doubt the abilities of central banks and governments to implement temporary fixes in the form of inflation until after the gold price has moved well into 4 digits and the yield on US Treasury Bonds has moved into double digits.
Gold
In an interesting article at http://www.safehaven.com/showarticle.cfm?id=8292, Ed Bugos explains that the biggest bull-market rallies in gold occur when the US Dollar's exchange rate is stable. In other words, when gold is in a long-term bull market -- as it almost certainly is right now -- its biggest gains are generally NOT driven by declines in the US$ relative to other paper currencies.
This makes perfect sense to us because the US$ is inherently no worse than the rest of the fiat currency bunch. In fact, the reserves that 'back' the other fiat currencies are mostly US$-denominated. It is therefore not surprising that gold's best performances occur in response to declining confidence in the overall fiat currency system rather than in response to falls in the value of one currency (the US$) relative to the others.
But while US$ weakness relative to the other fiat currencies is not a prerequisite for a gold rally, substantial STRENGTH in the dollar relative to other fiat currencies would very likely put irresistible downward pressure on the US$ gold price, at least in the short-term. This, we think, is a significant risk as far as the next few months are concerned.
There's a good chance that the Dollar Index will drop a bit lower over the coming fortnight, thus helping to push October gold up to the $695-$710 resistance range indicated on the chart presented below. The risk, for gold, is that the US$ will rebound sharply following its next test of major support at 80. Let's put it this way: from a relative valuation and sentiment perspective a sharp US$ rebound (versus the euro) appears to be a likely short-term prospect, and this represents a significant risk for gold. As a result, unless our currency market outlook changes we will be inclined to reduce our exposure to gold-related investments into strength over the next two weeks.


