


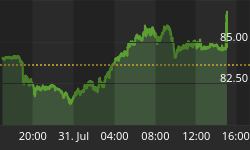


LET'S LOOK AT THE S&P 500 INDEX CHART

My forecast has been for this index to run up 12 trading days and then be vulnerable to a further correction. That is a probability developed from time cycles and we need the pattern of trending to confirm that probability. The analysis of the trend down shows an obvious exhaustion at the low that held the March low and that offers a probability of continuing the horizontal nature of the pattern by testing the high. The one day down last week held the previous August low showing some symmetry to the support leaving the exhaustion hanging there by itself and that tends to be a bullish configuration-"tends." The retracement of the move down has been up to 2/3rd of the decline and that is large for an index that is supposed be vulnerable. All that to say there needs to be something on the chart to justify the probability of a further move down. There is a chance for a high today but there also needs to be follow through to the downside if that occurs.
The last move down did overbalance price but did not yet overbalance time or exceed the number of days to the largest decline in the bull trend. So some evidence of the possibility of trending down would be helpful. As an inside day and a day that rallies and fails or a rally below the high day that fails-something. Today is the end of the cycle but a few days of distribution are still likely.
If the index moves higher next week it would negate the cycles and a test of the high and a larger distribution pattern is the next likely alternative and not an unusual circumstance considering the overbalance of price. But for now we are looking for evidence this rally is in trouble over the next few days.
NOW FOR A CONTRAST LET'S LOOK AT THE DAX INDEX

You can see this index held its February high and didn't go near the March low and the low wasn't much an exhaust. It now has a higher low and higher high and the support shown yesterday is very important if this is trending up. The point being, if there is going to be a secondary or lower high in the US stock indexes it should show up in the other world stock indexes. If that is true then the DAX needs to break the low on the fourth.
As I pointed out last week, when considering the technical extremes in consensus or fear hit at the exhaustion low in the US indexes, it would be helpful to see some evidence the next few days to have confidence in the probability represented by these cycles. So even though I said the rally had a high probability of running 12 trading days and here it is at 12 days that doesn't make me correct, there needs to be some indication of a problem with this uptrend. I don't believe we could stand anymore good news as there is now the prospect of a rate reduction and the bailout that isn't a bailout so the index is vulnerable but when viewing the larger picture there needs to be some evidence to confirm the validity of the cycle. One of your viewers last week asked if the Australian index ever leads the US index and today the Australian index showed a reversal day down. Exhausting the trend the first few days after the holiday is not unusual.


