


LET'S FIRST LOOK AT THE NASDAQ DAILY CHART

Please keep in mind indexes exhausts into tops. This is currently an exhaustion style of trend running not on economic optimism but on excessive leverage combined with excessive liquidity that is creating asset bubble after asset bubble. Stocks are the best place to park this liquidity and as long the trend remains intact this pyramid just keeps building. This is nothing new; this leverage is almost identical to previous periods in economic history.
You can see how the index was exhausting as indicated by the one and two day counter trend moves against the trend. The only time markets behave in this manner is when an exhaustion of the trend is taking place. You then go to consensus numbers to see how bullish and bearish every one is feeling and when extremes are hit the game is over. Consensus is close but not at extremes. I doubt it is over yet, more likely the index will now consolidate over the next few weeks.
LET'S LOOK AT THE S&P DAILY CHART

Back on September 19 on this show, I said to look out for the 10th as the 5 year cycle expires but even if this is significant there still needs to be a period of distribution before reversing this short term trend. And it won't look like the little "False Break" pattern that occurred in June and July. You seldom see the same pattern on the same chart page.
Since the index hit the exhaustion low it created a horizontal pattern and a test of the high was the probability. My forecast has called for the index to go into a sideways distribution pattern once this level was hit. But the "pattern of the trending" leaves some probabilities for higher levels for this leg so I need another week or two of trading to feel confident of the exact completion of this leg. It could end next week or extend to November 14.
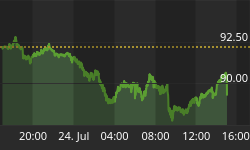
WE'VE BEEN FOLLOWING THE US DOLLAR INDEX ON THIS SHOW FOR A FEW MONTHS LETS LOOK AT THAT DAILY CHART

Last week I said to look for a rally of three or four days, if it could exceed that number of days the next low could bring a larger rally or consolidation of this fast trend down. The rally was 6 days but when you look closely it was 4 days and a marginal break to exhaust the rally. That is really close to the 4 days that does keep this fast trend intact. But I'd still be aware of what occurs at a new low as it could start a consolidation for a few weeks in order to keep this down leg intact. I still like $72 for the index and it is still possible to hit that with a big panic by 5 November if this doesn't start to consolidate after a new low next week.


