



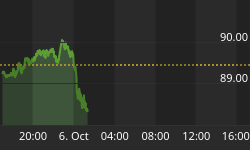


The London FTSE, German DAX, and Australia's SPASX200 are all approaching a top. The FTSE looks to be finishing a wave b-up inside a wave a-down, b-up, c-down for a correction of the recent multiyear Bull market. It is completing a Rising Bearish Wedged for wave b-up. Prices have exceeded the upper Bolling Band, two standard deviations above its 20 day moving average. It has also reached the 10 day average of each day's highs. These are normally places where tops occur. The same is true of the German DAX.


For the Australia SPASX200, on a long-term basis, Intermediate degree wave 1 up of primary (5) up likely completed in July. Massive international liquidity infusions by central banks have floated markets higher, where inflation is being used as a tool by central banks to ward off declines in the stock market. A huge Bull market phase will continue after the current Intermediate wave 2 correction finishes. The alternate labeling is that Intermediate 2 down completed in August and a huge Bull market, Intermediate wave 3 up has started. Arguing for the Bullish scenario is that the weekly MACD is close to generating a new "buy" signal, once the blue histograms go decisively positive. Arguing against it is a Bearish divergence with the London FTSE and the German DAX, which have failed to reach new highs.
Short-term, waves a-down, b-up, and c-down of Minor degree wave a-down are complete. Wave b-up is now very close to completion, with wave c-up nearly complete within an a-up, b-down, c-up for b-up. Intermediate 2-down is an a-down, b-up, c-down flat, so you can see we have further to go on the downside once the corrective rally finishes, and that this next decline, wave c, should last several weeks. Wave c-down will be a five wave decline. There is an alternate possibility that the wave 2 down correction completed at the August bottom, and the first rally leg of Intermediate wave 3 up has started and is approaching completion. That suggests the coming decline will be Minor degree wave 2 down.
It is possible that the waves are all one degree smaller than we have charted, which if that is the case, means a protracted decline is underway, lasting into mid-2008. If our degree of waves charted is correct, then Intermediate wave 2 down could wrap up by November, 2007.


"Jesus said to them, "I am the bread of life; he who comes to Me
shall not hunger, and he who believes in Me shall never thirst.
For I have come down from heaven,
For this is the will of My Father, that everyone who beholds
the Son and believes in Him, may have eternal life;
and I Myself will raise him up on the last day."
John 6: 35, 38, 40
For a FREE 30 Day Trial, go to
www.technicalindicatorindex.com
and click on the button at the upper right
of the home page.
Autumn Specials: 19 Months for $279.
or 1 Year for $189
Go to www.technicalindicatorindex.com and
click on the Subscribe Today button.
Good Through Wednesday, October 17th, 2007.





