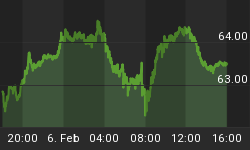
So far, Thursday's plunge in the Nasdaq, as gauged by the QQQQ's, represents only a "minor" pullback within the dominant August-Ocotber uptrend -- unless, of course, this recovery rally represents an impending secondary failure at the top of the Aug-Sept channel.
My work argues that it is the latter, and that the Q's will grind a bit higher on Monday, and then put in a second high coordinate within a near-term topping process in the 53.00-54.00 area.

Semiconductors, meanwhile, as represented by the SMH, had a big gap down Friday morning below both its rising 200 DMA and its 15-month support line (36.40/30), which could trigger potentially significant technical damage to the intermediate-term chart structure.
Even if the SMH manages to grind its way up to 37.00/20 again, my pattern and momentum work (hourly and daily) are encouraging me to remain short largely because my primary scenario has morphed into a bearish one.
The Sept-Oct upside failures at 39.00/30 and the subsequent weakens into today's low near 36.00 represents the downside continuation of the July-Aug decline from 41.41 to 34.99. If my work proves accurate, then the SMH is heading for 34.00-33.00 before this decline ends.

Moving over to the S&P side, I might be a touch early in my entry into the long side of the SDS (ProShares UltraShort S&P ETF) in our subscription service's model portfolio, but this chart is screaming NOT to be short right here.
This is not to say that the SDS will not go down, and may make new lows, but it is to say that downside sustainability is extremely suspect. This chart is subject to the "beachball" effect -- that no matter how much pressure one exerts to keep a beachball below water, once you let go the ball rips through the surface and flies.
Yes, I expect the SDS to act like a submerged beachball. The only question is how deep it is submerged before it releases towards the surface. I am long the SDS in our model portfolio and I am willing to take the risk that the beachball is very close to releasing to the upside.

On a more bullish note, crude oil has climbed to new all-time highs again... and based on my chart work, continues to have unfinished business on the upside.
Let's notice that Friday's new all-time high at $84.05 came on a Friday morning of a key upside reversal week, which imbues the overall chart picture with a potentially very bullish "event" that projects higher prices into the $86-$88/bbl area next.
At this juncture only a downside pivot reversal and plunge beneath $78.00 will compromise the still bullish oil chart.


