


The good news is:
• The blue chip indices hit all time highs on Tuesday.
Short Term
No one is selling.
You have to go back to late December 2004 during the Christmas / New Year holiday lull to find the level of NYSE downside volume as low as it is now.
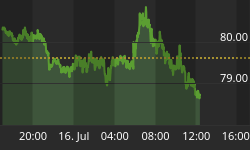
The chart below covers the past 9months showing the S&P 500 (SPX) in red and a 5% trend (19 day EMA) of NYSE downside volume (NY DV) in brown. NY DV has been plotted on an inverted Y axis so decreasing values of the indicator move the indicator upward. There are dashed vertical lines drawn on the 1st trading day of each month.
The indicator is at its highest level since Late December 2004.

Intermediate Term
This section is an update of charts I showed last week.
The patterns that define a cycle top are a high in all of the major indices confirmed by the breadth indicators then a decline, followed by a return to new highs in the blue chip indices unconfirmed by the breadth indicators and the small cap indices.
The chart below covers the past year showing the SPX in red and the NYSE advance - decline line (NYSE ADL) in green. The NYSE ADL and SPX hit their all time highs around June 1. The SPX hit another all time high on July 19 but the NYSE ADL did not. Last Tuesday the SPX hit another all time high while the NYSE ADL was well off its old highs.

The next chart shows the SPX in red and a 10% trend (19 day EMA) of NYSE new highs (NY NH) in green. NY NH peaked in December of 2006 and has been reaching progressively lower highs with each higher high in the SPX.

The next chart is similar to the one above except it shows the OTC in blue and the new high indicator OTC NH has been calculated from NASDAQ data. OTC NH has been the strongest of the breadth indicators and is the closest of all of them to a new high. The current value of the indicator is 125 so NASDAQ new highs above 125 will move the indicator upward. In the chart, the highest value for the indicator, reached last February, was 144. A higher high in the indicator would suggest the bull market has further to go.

All of the conditions are in place for a cycle top.
Seasonality
Next week includes the week prior to the 3rd Friday in October during the 3rd year of the Presidential Cycle.
The tables show the daily change of the indices during the week prior to the 3rd Friday in October. OTC data covers the period from 1963 - 2003 and SPX data from 1953 - 2003. There are summaries for both the 3rd year of the Presidential Cycle and all years combined. Prior to 1953 the market traded 6 days a week so that data has been ignored.
The coming week in the 3rd year of the Presidential cycle the OTC has been up only 36% of the time with an average loss of over 1%. The SPX has been only slightly better, up 54% of the time but with an average loss still over 1%. Over all years the averages have been up slightly more than half of the time and the returns, on average, have been modestly positive.
Report for the week before the 3rd Friday of October.
The number following the year is the position in the presidential cycle.
Daily returns from Monday through 3rd Friday.
| OTC Presidential Year 3 | ||||||
| Year | Mon | Tue | Wed | Thur | Fri | Totals |
| 1963-3 | 0.26% | -0.03% | 0.14% | 0.90% | 0.26% | 1.53% |
| 1967-3 | -0.29% | -0.91% | -0.45% | 0.24% | 0.04% | -1.38% |
| 1971-3 | -0.03% | 0.18% | -0.20% | -0.74% | -0.25% | -1.03% |
| 1975-3 | 0.96% | 0.63% | 0.01% | 0.03% | -0.75% | 0.88% |
| 1979-3 | -1.65% | -0.04% | 0.51% | 0.30% | -2.06% | -2.93% |
| 1983-3 | -0.12% | -2.10% | -1.33% | 0.50% | -0.63% | -3.67% |
| Avg | -0.23% | -0.45% | -0.29% | 0.07% | -0.73% | -1.63% |
| 1987-3 | -1.23% | 0.41% | -1.50% | -1.35% | -3.83% | -7.50% |
| 1991-3 | 1.27% | 1.61% | 1.28% | -0.86% | 0.49% | 3.79% |
| 1995-3 | -0.03% | 1.70% | 0.97% | 0.15% | -0.72% | 2.07% |
| 1999-3 | 1.02% | -1.50% | -2.48% | 0.20% | -2.67% | -5.43% |
| 2003-3 | 0.95% | 0.50% | -0.21% | 0.57% | -1.94% | -0.13% |
| Avg | 0.40% | 0.54% | -0.39% | -0.26% | -1.73% | -1.44% |
| OTC summary for Presidential Year 3 1963 - 2003 | ||||||
| Avg | 0.10% | 0.04% | -0.30% | -0.01% | -1.10% | -1.26% |
| Win% | 45% | 55% | 45% | 73% | 27% | 36% |
| OTC summary for all years 1963 - 2006 | ||||||
| Avg | 0.21% | 0.00% | -0.14% | 0.42% | -0.13% | 0.36% |
| Win% | 63% | 52% | 47% | 66% | 57% | 52% |
| SPX Presidential Year 3 | ||||||
| Year | Mon | Tue | Wed | Thur | Fri | Totals |
| 1955-3 | 0.32% | 0.73% | 1.01% | 1.24% | 0.00% | 3.29% |
| 1959-3 | 0.56% | -0.28% | -0.79% | 0.28% | 0.81% | 0.59% |
| 1963-3 | 0.04% | 0.14% | 0.79% | 0.40% | 0.08% | 1.45% |
| 1967-3 | -0.78% | -0.26% | 0.26% | 0.19% | -0.05% | -0.64% |
| 1971-3 | -0.20% | 0.41% | -0.54% | -0.91% | -0.35% | -1.59% |
| 1975-3 | 1.42% | -0.20% | -0.06% | 0.16% | -0.57% | 0.75% |
| 1979-3 | -1.08% | -0.16% | 0.19% | 0.21% | -1.94% | -2.78% |
| 1983-3 | 0.34% | -1.54% | -0.64% | 0.15% | -0.62% | -2.31% |
| Avg | -0.06% | -0.35% | -0.16% | -0.04% | -0.71% | -1.31% |
| 1987-3 | -0.54% | 1.66% | -2.95% | -2.34% | -5.16% | -9.34% |
| 1991-3 | 1.32% | 1.17% | 0.46% | -0.22% | 0.15% | 2.87% |
| 1995-3 | -0.25% | 0.64% | 0.11% | 0.55% | -0.54% | 0.51% |
| 1999-3 | -0.06% | -1.66% | -2.09% | -0.17% | -2.81% | -6.79% |
| 2003-3 | 0.70% | 0.40% | -0.26% | 0.32% | -1.02% | 0.13% |
| Avg | 0.23% | 0.44% | -0.95% | -0.38% | -1.88% | -2.52% |
| SPX summary for Presidential Year 3 1955 - 2003 | ||||||
| Avg | 0.14% | 0.08% | -0.35% | -0.01% | -1.00% | -1.07% |
| Win% | 54% | 54% | 46% | 69% | 25% | 54% |
| SPX summary for all years 1953 - 2006 | ||||||
| Avg | 0.29% | -0.03% | -0.18% | 0.19% | -0.15% | 0.13% |
| Win% | 64% | 37% | 45% | 59% | 49% | 57% |
Mutual Fund
Compliance issues demand that I not mention the mutual fund that I manage by name or symbol in this letter.
To see a current chart of the fund go to: http://finance.yahoo.com/q/bc?s=APHAX&t=6m&l=on&z=m&q=l&c=.
For information about the fund go to: http://www.thealphafunds.com/index.htm. The fund now has service class shares available.
Conclusion
Nothing in the past week changed my expectation that we are at or near a market cycle high. In addition to deterioration in the breadth indicators the seasonal patterns are weakening.
I expect the major indices to be lower on Friday October 19 than they were on Friday October 12.
This report is free to anyone who wants it, so please tell your friends. They can sign up at: http://alphaim.net/signup.html.If it is not for you, reply with REMOVE in the subject line.
Last the large cap indices were up slightly and the small cap indices were down slightly so I am calling last weeks negative forecast a tie.


