


11/2/2007 7:26:01 PM
Not a subscriber yet? Want to be? Click here and sign up for a no cost trial. Sign up for our TRADE TUTOR weekly newsletter at no cost to get a trading education from Pro Traders.
Our services' net portfolio gain is 78.26% over 10 months. An 87.89% Annualized Return! For a full break up of this performance, CLICK HERE.
Our system remains in Buy mode, with the market essentially moving in a broad sideways pattern, it's good to have both sides of the market covered. In addition, with 2 weeks to expiry on our positions, we have a 100-point buffer (or almost 7%) on both the calls and the puts.
Position Recap:
On October 23rd we sold an SPX Nov 1610(SPBKB)/1620(SPBKD) Call Option Spread for a net credit of $0.40.
On October 29th we sold an SPX Nov 1410(SXZWB)/1400(SXZWT) Put Option Spread for a net credit of $0.40.
(i.e. a total premium received of $80 per $1,000 of margin)
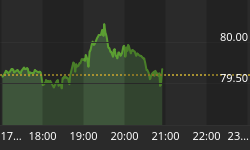
SPX Chart

NDX Chart

We got a decent break above 2200 on the NDX mid week (last week I mentioned how a break above 2200 would be the next show of strength). We've now finished the week at 2214 and while this is above the 2200 level, it's not all that convincing still and could turn out to be a fake out break out.
On the SPX side, the breakdown on Thursday was very sharp and if we close below 1490, it would signal more weakness ahead. For now, the SPX is in trading range between 1490 and 1540 and we could see it trade in this range for a while before it decides on a direction. A Christmas rally remains on the cards while the Nasdaq remains strong.
Have a great weekend and Feel free to email me directly at angelo@stockbarometer.com if you have any feedback or questions.


