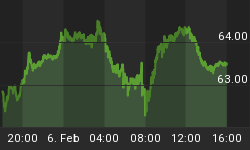
Last week we shared our Intra-Day, short term Point & Figure model and how that showed a down condition. Yesterday, investors wanted to know "What impact did Bernanke have on the markets, and what did that mean for today?"
Yesterday's Intra-day, 20 minute P&F model and whatit said ...
Our short term, P&F Intra-Day Model of market shifts is shown below. (This in not a long term chart, but an short term intra-day chart.
In today's graph we are looking at the SPY's intra-day chart. (The SPY and S&P 500 is regarded as the best index to measure the over-all economy by Institutions.)
The model works on a combination of conditions:
1. If the P&F Price has moved above the red/blue trend lines on the Point & Figure chart, AND the Movement Shift Indicator closes above the white horizontal signal line at the same time, then that is an intra-day up signal.
2. If the Price has moved above the red/blue trend lines on the Point & Figure chart, AND the Movement Shift Indicator closes below the white horizontal signal line at the same time, then that is NOT an intra-day up signal ... especially if the red/blue P&F trend lines are still moving down. This would remain a down condition.
What happened on this shorter term model yesterday? First, the price did move up above the red/blue trend lines ... a good condition. However, the red/blue trend lines remained in a down trend and did not crossed over to the upside ... and second, the Movement Shift Indicator remained below the white horizontal signal line. That was a non-confirmation of a short term up condition, a condition that remained a down condition. Take a look at the white boxes that I drew on the chart. We had similar a condition on the left hand side of the chart which ended up in another down wave.
Conclusion: Yesterday's up move in the market was not sufficient to have a condition that could move higher without failing to the downside. At the close yesterday, we still had a down condition for this morning's open which had us open with a gap down.
Today will remain a down condition for the SPY unless the market moves back positive today, with the price remaining above the red/blue trend lines, AND the Movement Shift Indicator moving up and closing above the white horizontal signal line. Without these conditions occurring by the end of the day, this would remain a short term down condition for Monday.


