


The good news is:
• The market is near record oversold extremes and likely to have a tradable rally.
Short Term
The market is nearly as oversold as it has ever been.
As of Friday's close 8% of the component issues of the S&P 500 (SPX) are above their respective 50 day EMA's. There have been lower numbers, but not many.
The charts below show every example in the last 12 years when the percentage of the SPX component issues above their respective 50 day EMA's fell below 10%.
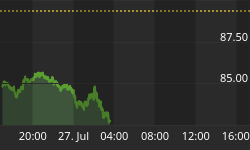
Each chart covers 12 months showing the SPX in red and the percentage of the component issues of the SPX above their 50 day EMA's in olive drab. The dates and values of the extremes have been identified. Dashed vertical lines have been drawn on the 1st trading day of each month and dashed horizontal lines have been drawn at 25%, 50% & 75% levels for the indicator.
The 1st chart covers the past 12 months.

The next most recent example of readings below 10% occurred in 2002.
On 7/23/02 there were no issues above their 50 day EMA's. From that low the SPX rallied 14.3% in 6 trading days then fell nearly 10% in 3 days. In the next 13 trading days on 8/22/02 the SPX rallied to 20.7% above its low of 7/23 (meeting the media definition of a bull market) before falling to a new, and final, low on October 9.

The next most recent example of readings below 10% occurred in 2001.

I think market patterns in 1998 offer the closest examples to what we are seeing now. On August 31, 1998 the indicator dropped to 3% as the SPX hit its low for the year. Over the next month the SPX rallied 10.2% before falling to a slightly lower low about 2 weeks later.

Rallies from the oversold extremes we are experiencing have been explosive.
Intermediate Term
When the market hits a low with an extreme number of new lows it usually retests that low. Near the August low there were 480 new lows on the NASDAQ implying a retest of that low. Near the late November low there were 359 new lows, less than the August low, but still enough to suggest another retest. On Friday there were 485 new lows on the NASDAQ suggesting another retest.
The chart below covers the past year showing the NASDAQ composite (OTC) in blue and a 10% trend (19 day EMA) of NASDAQ new lows (OTC NL) in red. OTC NL has been plotted on an inverted Y axis so decreasing new lows move the indicator upward (up is good). OTC NL is at its lowest point since the 2002 bottom.

The next chart covers 3 years from late 1999 to bottom in 2002 showing the OTC and OTC NL. The chart is offered to give you a perspective on how the indicator looks during a bear market.

Seasonality
Next week is the week prior to the 4th Friday in January during the 4th year of the Presidential Cycle.
The tables show the daily change of the OTC and SPX during the week prior to the 4th Friday in January during the 4th year of the Presidential Cycle. OTC data covers the period from 1964 - 2004 and SPX data from 1953 - 2004. There are summaries for both the 4th year of the Presidential Cycle and all years combined. Prior to 1953 the market traded 6 days a week so that data has been ignored.
Historically the coming week has been the weakest week in January which is usually a strong month. Given the recent lack of conformity to seasonal patterns, it will probably be up.
Report for the week before the 4th Friday of Jan
The number following the year is the position in the presidential cycle.
Daily returns from Monday through the 4th Friday.
| OTC Presidential Year Year 4 | ||||||
| Year | Mon | Tue | Wed | Thur | Fri | Totals |
| 1964-4 | 0.00% | -0.76% | 0.14% | -0.22% | 0.36% | -0.49% |
| 1968-4 | 0.00% | -0.94% | -0.72% | -0.08% | -0.34% | -2.08% |
| 1972-4 | -0.61% | -0.16% | 0.08% | 0.84% | 0.91% | 1.05% |
| 1976-4 | 0.51% | 0.20% | 0.06% | -0.39% | 0.76% | 1.14% |
| 1980-4 | 0.77% | -0.27% | 1.01% | 0.47% | 0.29% | 2.26% |
| 1984-4 | -1.48% | -0.49% | -0.53% | -0.63% | -0.88% | -4.01% |
| Avg | -0.20% | -0.33% | -0.02% | 0.04% | 0.15% | -0.33% |
| 1988-4 | 0.86% | -0.38% | 0.17% | 0.75% | 0.67% | 2.08% |
| 1992-4 | -1.19% | -2.36% | 2.64% | 0.35% | 0.29% | -0.28% |
| 1996-4 | 1.07% | -0.14% | 1.51% | -0.72% | 0.48% | 2.21% |
| 2000-4 | -3.29% | 1.74% | -2.34% | -0.74% | -3.78% | -8.41% |
| 2004-4 | 0.00% | 0.35% | -0.26% | -1.09% | 0.23% | -0.77% |
| Avg | -0.64% | -0.16% | 0.34% | -0.29% | -0.42% | -1.03% |
| OTC summary for Presidential Year 4 1964 - 2004 | ||||||
| Avg | -0.42% | -0.29% | 0.16% | -0.13% | -0.09% | -0.66% |
| Win% | 50% | 27% | 64% | 36% | 73% | 45% |
| OTC summary for all years 1963 - 2007 | ||||||
| Avg | -0.20% | 0.06% | 0.12% | 0.15% | 0.09% | 0.24% |
| Win% | 53% | 48% | 51% | 49% | 70% | 61% |
| SPX Presidential Year 4 | ||||||
| Year | Mon | Tue | Wed | Thur | Fri | Totals |
| 1956-4 | -0.25% | 1.25% | 0.16% | -0.59% | -0.25% | 0.31% |
| 1960-4 | -1.05% | 0.14% | -0.25% | -1.04% | -0.93% | -3.12% |
| 1964-4 | -0.20% | 0.27% | 0.54% | 0.08% | 0.03% | 0.72% |
| 1968-4 | -1.27% | -0.39% | -0.52% | 0.14% | 0.16% | -1.89% |
| 1972-4 | -1.04% | 0.20% | -0.27% | 0.98% | 0.64% | 0.50% |
| 1976-4 | 1.36% | 0.55% | -0.63% | -0.20% | 1.19% | 2.27% |
| 1980-4 | 0.93% | -0.53% | 1.73% | 0.23% | -0.08% | 2.28% |
| 1984-4 | -0.81% | 0.65% | -0.66% | -0.36% | -0.18% | -1.37% |
| Avg | -0.17% | 0.10% | -0.07% | 0.16% | 0.35% | 0.36% |
| 1988-4 | 2.30% | -1.03% | -0.08% | 1.57% | 1.49% | 4.25% |
| 1992-4 | -0.60% | -0.89% | 1.33% | -0.76% | 0.13% | -0.79% |
| 1996-4 | 0.26% | -0.10% | 1.17% | -0.47% | 0.74% | 1.60% |
| 2000-4 | -2.74% | 0.58% | -0.42% | -0.39% | -2.75% | -5.72% |
| 2004-4 | 0.00% | -0.09% | 0.78% | -0.32% | -0.21% | 0.15% |
| Avg | -0.20% | -0.31% | 0.56% | -0.08% | -0.12% | -0.10% |
| SPX summary for Presidential Year 4 1956 - 2004 | ||||||
| Avg | -0.26% | 0.05% | 0.22% | -0.09% | 0.00% | -0.06% |
| Win% | 33% | 54% | 46% | 38% | 54% | 62% |
| SPX summary for all years 1953 - 2007 | ||||||
| Avg | -0.13% | 0.12% | 0.08% | 0.18% | 0.07% | 0.33% |
| Win% | 49% | 62% | 53% | 59% | 57% | 67% |
Conclusion
The market is near record oversold conditions so a significant bounce is likely.
I expect the major indices to be higher on Friday January 25 than they were on Friday January 18.
This report is free to anyone who wants it, so please tell your friends. They can sign up at: http://alphaim.net/signup.html. If it is not for you, reply with REMOVE in the subject line.
Last weeks positive forecast based on a rally from an oversold condition was a miss.


