


Bi-Weekly Stock Barometer No. 174
1/26/2008 11:03:25 AM
Introducing free weekly charts - posted weekly on our site.
Welcome to the biweekly stock barometer. This article comes out every 2 weeks and gives our big picture view of the market. If you're interested in following our signals and learning more about our system, then I invite you to click here and subscribe to the daily service - since the market can turn on a dime and so too can our interpretation as the market gives its daily clues to the future. Or sign up for our free weekly newsletter, where we provide up to date articles from our various trading services.
We also offer a free weekly indicator chart if you visit our home page and scroll to the bottom. This chart will be updated each week, so be sure to check back frequently for updates. www.stockbarometer.com - don't forget to scroll to the bottom.
There are numerous technical indicators you can follow. Over the years of doing this business, I've seen more than you can imagine. We'll look at one here. Visit the site to see this week's free indicator chart.
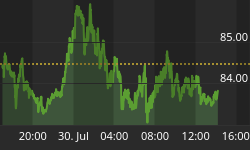
The following chart is an Up/Down indicator of the QQQQ and the SPY. This is a basic, yet very powerful tool. It simply maintains a sum of the up days and the down days, with the basic premise that the market can only go up for so long before it has to go lower. Now as with any indicator, you can look at various time frames. We first calculate the 3 day moving average of up days less down days. Then we look at a 9 day moving average of this value.

The end result is an indicator that simply moves higher and lower with the market and should reach extremes at market highs and lows. What this indicator doesn't show is a relationship with price movement. So minor moves in the market can move the indicator to extremes. You can resolve this by setting a filter on the amount of move (on a price or percentage basis) that it takes to be considered a move higher or lower.
As you should know, no indicator is perfect. And this one by no means is the holy grail of trading that is going to give you all the answers of when to buy and when to sell. All indicators should be interpreted as a whole in making your investment and trading decisions. And at the end of the day, price action rules. But knowing how overbought or oversold a market is and in what time frame, can only serve to make your next decision more educated.
On to the charts.
Message From The Markets
Market action is ruled by sentiment and by monitoring market internals and studying sentiment you can reasonably predict future market movements. The basis of the Stock Barometer system is overlaying extremes in sentiment with sound technical analysis to predict the likelihood of future price movement. Each indicator and chart measures the hope, fear and greed of investors and traders from different angles. Follow along with my charts and over time, you'll also learn to understand how to read the markets, which is essential prior to setting up each and every trade.
STOCK BAROMETER CHART

The Daily Stock Barometer is a proprietary measure of market energy. The direction of the stock barometer determines our short-term outlook on the market's direction. A BUY or SELL signal is triggered when the indicator clearly changes direction. If the line is moving up, we are in BUY MODE and if it's moving down, we are in SELL MODE. The black line is a 5-day moving average that we use to confirm changes in direction. We may wait for the QQQQs to break support or resistance before changing mode.
EQUITY PUT CALL RATIO CHART

The CBOE put/call ratio is comprised of two sets of data; equity options and index options. The index component contains items that are used as a hedge, thereby distorting the correlation and interpretation of the indicator. I use the equity put/call ratio. This is one of the most accurate read of investor's fear and complacency.
TRIN/ARMS CHART

Richard Arms developed the arms index. It is also referred to the Trading Index or TRIN for short. It is a measure of the ratio of up stocks and down stocks divided by the ratio of up volume and down volume. Our Spread Chart converts the arms index data into momentum Buy and Sell Signals.
TICK CHART

The tick index is represents the sum of all stocks ticking higher minus all stocks ticking lower (a stock is said to be trading on an up tick when it trades at a higher price than the last sale). It's utilized as a day trading tool as it gives you an up to the second read of the intensity of buying and selling.
BREADTH (ADVANCE - DECLINE) CHART

Each day several thousand stocks either advance, decline or remain unchanged. The number of advances and declines normally ranges from +2500 to -2500. A high number of advancing stocks normally marks a top just as a high number of declining stocks normally marks a bottom. Monitoring the 5 and 13-day moving averages of this allows us to better predict future prices.
VXO CHART

The VIX is a measure of volatility on options pricing. We use the old VIX, which is now called the VXO. The higher the volatility, the more likely the market is close to a bottom, as traders are willing to pay more premium for puts, which act as Insurance on their long positions.
Cycle Time
Monday will be day 2 in our UP cycle.
The Stock Barometer signals tend to follow a 5, 8 and 13 and sometimes 21 day Fibonacci cycle that balance with 'normal' market cycles. Knowing where you are in the current market cycle is important in deciding how long you expect to maintain a position.
Potential Cycle Reversal Dates
2008 Potential Reversal Dates: 1/11, 2/1, 2/13. We publish these dates up to 2 months in advance.
With our next date as 2/1, we expect a move up into that date.
My timing work is based on numerous cycles and has resulted in the above potential reversal dates. They're predictive and have nothing to do with the barometer cycle times. However, due to their accuracy in the past, I post the dates here.
2007 Potential Reversal Dates: 1/10, 1/14, 1/27, 1/31, 2/3, 2/17, 3/10, 3/24, 4/21, 5/6, 6/15, 8/29, 10/19, 11/29, 12/13, 12/24, 12/31.
2006 potential reversal dates: 1/16, 1/30, 2/25, 3/19, 4/8, 5/8, 5/19, 6/6(20), 7/24, 8/20, 8/29, 9/15, 10/11, 11/28.
2005 Potential reversal dates based on 'other' cycle work were 12/27/04, 1/25/05, 2/16, 3/4, 3/14, 3/29, 4/5, 4/19, 5/2, 6/3, 6/10, 7/13, 7/28, 8/12, 8/30-31, 9/22, 10/4, 11/15, 11/20, 12/16.
Stock Barometer Buy And Sell Signals
QQQQ or SPY Chart: A chart is provided in every bi-weekly report and shows the barometer Buy and Sell Signals (which are provided in my morning updates) as well as showing the next highlighted 'reversal' window. The numbers adjacent to the buy and sell signals are the number of days between signal (cycle time).
Here's one years of our end-of-day buy and sell signals for the Stock Barometer over the past year. They're marked on the QQQQ chart with red and blue lines (or red and blue arrows). Note we recently changed bottom and top to read buy and sell.
| • | 02/01 | Projected SELL Signal (6 days from last signal) | |
| • | 01/24 | BUY (4 days) | |
| • | 01/17 | CASH (3 days) | |
| • | 01/14 | BUY (6 days) | |
| • | 01/04 | SELL (9 days) | |
| • | 12/20 | BUY (3 days) | |
| • | 12/17 | SELL (23 days) | |
| • | 11/13 | BUY (4 days) | |
| • | 11/07 | SELL (7 days ) | |
| • | 10/29 | BUY (13 days) | |
| • | 10/10 | SELL (3 days) | |
| • | 10/5 | BUY (2 days) | |
| • | 10/3 | SELL (2 days) | |
| • | 10/1 | BUY (1 days) | |
| • | 9/28 | SELL (12 days) | |
| • | 9/12 | BUY (4 days) | |
| • | 9/06 | SELL (3 days) | |
| • | 8/31 | BUY (3 days) | |
| • | 8/29 | SELL (7 days) | |
| • | 8/17 | BUY (3 days) | |
| • | 8/14 | SELL (4 days) | |
| • | 8/8 | BUY (16 days) | |
| • | 7/17 | SELL (3 days) | |
| • | 7/12 | BUY (15 days) | |
| • | 6/20 | SELL (4 days) | |
| • | 6/14 | BUY (20 days) | |
| • | 5/15 | SELL (27 days) | |
| • | 4/5 | BUY (7 days) | |
| • | 3/27 | SELL (13 Days) | |
| • | 3/8 | BUY (34 days) | |
| • | (historical reversal dates and performance figures are published at the Performance Page on the home page and updated at least annually) | ||
The following work is based on my spread/momentum indicators for the QQQQ, GLD, USD, USO and TLT. They are tuned to deliver signals in line with the Stock Barometer and we use them only in determining our overall outlook for the market and for pinpointing market reversals. The level, direction, and position to the zero line are keys in these indicators. For example, direction determines mode and a buy signal 'above zero' is more bullish than a buy signal 'below zero'.
Gold Spread Indicator (AMEX:GLD)

To trade Gold, utilize the Gold ETF AMEX:GLD. This gives us a general gage to the overall health of the US Economy and the markets, as well as to assists us in the entry of positions in our stock trading service.
US Dollar Index Spread Indicator (INDEX:DXY)

To trade the US Dollar, I'd utilize the Power Shares AMEX:UUP: US Dollar Index Bullish Fund and AMEX:UDN: US Dollar Index Bearish Fund.
Bonds Spread Indicator (AMEX:TLT)

To trade Bonds, I recommend Lehman’s 20 year ETF AMEX:TLT. Note that the direction of bonds can have an impact on the stock market. Normally, as bonds go down, stocks will go up and as bonds go up, stocks will go down.
OIL Spread Indicator (AMEX:USO)

To trade OIL, utilize AMEX:USO, the OIL ETF. We look at the price of oil as its level and direction can have an impact on the stock market.
Summary & Outlook
The barometer is in BUY MODE and we expect the markets to move higher into 2/1.
That being said, we are seeing a quick adoption to buy calls - suggesting an over complacent market still and an increased likelihood of the move lower continuing into a final climax low.
I hope you enjoyed the biweekly stock barometer. This article comes out every 2 weeks and gives our big picture view of the market. If you're interested in following our signals and learning more about our system, then I invite you to click here and subscribe to the daily service - since the market can turn on a dime and so too can our interpretation as the market gives its daily clues to the future. Or sign up for our free weekly newsletter, where we provide up to date articles from our various trading services.
We also offer a free weekly indicator chart if you visit our home page and scroll to the bottom. This chart will be updated each week, so be sure to check back frequently for updates. www.stockbarometer.com - don't forget to scroll to the bottom.

As always, if you have any questions or comments, feel free to email me here at jay@stockbarometer.com.
Regards,


