


Analysis is presented on the US dollar Index, Gold BUGS Index (HUI) and S&P 500 Index. The two chart types present include:
1) Daily charts showing Bollinger band (BB) patterns (21 MA in red, 34 in blue and 55 in green) and full stochastics with settings gauged to each index and 50, 200 day MA, with MACD.
2) Elliott Wave analysis of shorter term counts (alternate counts shown in gray.
Thoughts
What to discuss this week other than the California election is quickly becoming a three-ring circus with over 100 people striving to become governor. I find a lot of the news has numbed peoples perception of reality lately and is kind of a Bread and Circus type of carnival....make everyone feel good and forget about the longer-term problems most countries are faced. Last weeks article touched upon the S&P and US dollar rallying after Decemberish to March (in that time frame). Both the S&P and US dollar are in a very narrow trading range. Bollinger Bands on the S&P are very tight so a move up or down is expected soon (a more thorough description is given in the analysis section). August 18, 2003 as I finish the text for this editorial is a Fib date for minor and minute degree Elliott patterns. It will be interesting to see how the week moves, because the HUI has at least 2-3 months prior to signaling the end of the move.
We went to a friends parents cottage on Lake of the Woods for the day on Sunday. I grew up on the lake area, and it truly is a gem of Northwestern Ontario. Real estate prices have always been somewhat expensive....but as of late, one requires a significant inheritance or a very well paying job to just buy land. Any lot with roadside access (no cottage will run for $200-300 K pending the location. Boat access lots range from $60-80K. Prices are absolutely rampant due to some $2-4 million dollar cottages being built. A friend of my best friend's parents is a mason in the area, and has spoke of building $60,000 fireplaces for cottages. It is 2000 all over again, with the excesses that top corporate executives wiping icing all over the area. To me the average Joe with real estate and home ownership will not be the first signal the real estate market is over. When the prices of cottages begin to drop due to people not being able to afford them and it percolates through all levels of society, then and only then will we have an idea as to the near peak in real estate. I can safely say that cottage country in our area is showing no signs of weakening yet. I think we will have a nice upleg next year causing most bears to have extinguished their views and ride with the bulls. That is when things will begin to unwind. Interestingly, the Presidential cycle is up next year, and with the influence that the US government places globally, it is hard to think that next year would not be an up year. Like the heroine addict taking drugs that knows will harm him or her, that buzz is more important....to hell with tomorrow and live for today. Withdrawals from coffee are not very pleasant and I could only imagine how difficult drug withdrawals are. Just imagine when the US government has to withdrawal from not being able to crank out the printing presses. Since most governments hold over 50% of their holdings with US fiat money, the rapid printing going on by the FED is diluting their value. But in order for other countries to export goods to the US to keep their own economies going, they have no real choice but to buy US bonds and treasuries. Will a rapid repatriation out of the US dollar occur? I am sure it will start out slow and snowball as it runs down the slope of time. What form of backed currency will occur in the future besides it being backed by gold is uncertain. If monetary inflation is defined by expansion of currency, then classically we are in an inflationary period. In past periods of inflation, wages have been ramped up to match it. Currently though most people are being forced to have their salaries at a fixed level with very small increases per year. The good ol home refinancing programs are what is keeping most people alive now to keep up their lifestyles. I do not think this will be a typical inflationary period, because most governments and corporations will not be able to give employees larger salaries as everyone and every department is swimming in debt. When currency expansion is no longer viable for the FED, then that will put the brakes on everything. If the currency implodes and the total debt comes in, then the debt exceeding total currency would cause deflation, plain and simple. How would the price of gold react here, would it decrease as it has in prior deflationary periods, or increase due to the global shortages based on population and a lack of trust in fiat??? I know in such an event, I would only trust gold. One thing that is true f this era that can be summed up as follows: The elderly always speak of their youth as the glory years and speak of the present with a pain here and a pain there....This sounds the way we ALL will think of the nineties and the hangover party mode the economy is operating in.
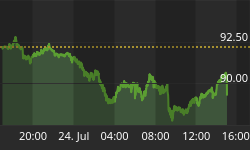
US Dollar Index
Figure 1 shows the daily USD index with BB's and stochastics. The upper BB's are set to fall, but the lower BB's must converge to signal the later sell signal, which appears to be set for late September/early October. The full stochastics are still in bull mode with room to run. As I speak the USD is completing a pattern somewhat like the Elliott chart describes. Figure 2 shows the USD chart with moving averages and MACD. The 200 day MA is still above the 50 day MA, but a turn around is coming, after a decline phase first. The MACD is bumping up against the longer term down trend-line with the slow stochastics set to cross the faster (bearish). We can expect resistance until a final leg down then off to the races. The rally stands to be quite strong. Owning US stocks near the bottom will allow for an increase in stock value, and the USD rise relative to ones own currency (a double play).
Figure 1. US dollar index with Bollinger bands and full stochastics.
Figure 2. US dollar index with moving averages and MACD.
Figure 3 shows the Elliott Wave pattern for the past monthly action (refer to prior issues for the longer-term count). The USD has two possible counts here right now, with both pointing to some form of ending triangular structure. The shorter-term counts are looser due to the changes that can occur, but the narrow trading range still applies.
Figure 3. Elliott Wave Analysis of the US dollar Index
Gold BUGS Index (HUI)
Figure 4 shows the HUI chart with BB"s and full stochastics. The lower BB's appear set to form another ribbon structure, indicative of further upside. The upper BB's are riding the current wave up which is bullish. Stochastics have another 3-4 months of apparent upside in a rising channel. Figure 5 shows HUI chart with MA's and MACD. The 50 day MA is above the 200 day MA, indicative of the longer-term trend. The 50 day MA has been above the 200 day Ma for nearly the entire move since November, 2001. The MACD has been rising also since then and faster moving line (brown) has moved much ahead of the slower line (green). Both charts have the technicals in place for higher upside movement. Even if there were weakness in gold, the prices would "hang around" current levels prior to initiation of the downside. That requires confirmation, and the upside suggested in the charts lies ahead of us.
Figure 4. HUI chart with Bollinger bands and full stochastics.
Figure 5. HUI chart with moving averages and MACD.
Figure 6 shows the Elliott Wave pattern of the HUI in the move up since July 17, 2003. The wave structure when a very valid count is in place has a high degree of significance. Last week I stated that the current subwave structure of minute degree could reach 216 if wave [v] was to be 1.68x longer than wave [iii]. The current wave under examination of lower degree counts has two possibilities that will be explained. Firstly, the first wave in this pattern was extended in regards to price and time. The price factor was only wave I being 53% in relation to wave iii (not the 161.8%), but close enough. Wave ii was fairly complex, and must have internal subdivisions following an extended wave i to make the pattern valid. Wave iii was 19.46 price units, so wave v MUST be 19.46 price units or lower pending completion of wave iv. This would put a top on the HUI of somewhere between 189 to 200 pending how low the HUI corrects here. This move would complete wave (i) with two more upleg segments suggestive in the Elliott Wave chart, and the technicals presented in Figures 4 and 5. Worst case scenario is that the move up completed the wave structure since April. This creates an ackward Elliott pattern in regards to wave [iii] and [v] being similar in price. Wave [iii] is longer in time and has a higher degree of complexity, so that would count as having the pattern complete. However, we still need one more leg up minimally to satisfy the current wave structure. The upside in gold and gold stocks exists until the end of November/December unless the technicals drastically change. If the current wave pattern was to extend, then 216 to 254 would be the target range for completion of the wave structure presented of minute degree. It should be noted that a move of the HUI below 172 would nullify the count presented, and a regrouping of labels required. The current correction should not drop below 173. It appears the HUI will correct and consolidate this week (prior to the upside of the next wave). After we complete the next leg up, whatever range it hits, there will be a consolidation period. The HUI may "sit and wait" until gold advances to a higher price before joining in. Buying or selling gold stocks is a personal decision and the information presented for the HUI is meant to show the current path. Longer term, gold is very good, as well as the shorter term. However, when the S&P bottoms along with the USD, there is a high chance that gold and gold stocks will take a significant hit. People with stock losses accumulated could take profits with no tax consequences and pile in at lower prices. People holding stocks, at least in Canada must count on for a minimum drop of 25% in the stock to make it worthwhile (The government will take 25% of the money earned on a stock). The buy and hold approach will accumulate the most amount of money if corrections are below 25%. The thing is...how do we know what depth a correction will go. That will depend upon the runup in the HUI and how low the USD drops and stands to bounce back. This will be examined at a much later date when we have to deal with it. Right now, the wind is under the gold sails and everything is fine so no need to worry yet.
Figure 6. Elliott Wave Analysis of the HUI.
S&P 500 Index
Figure 7 shows the S&P chart with BB's and stochastics. The upper BB's are sloping downward with the 55, 34 and 21 from top to bottom indicative of a decline. The lower BB's are set to merge. Prior situations generally have all three BB's going sideways for up to 3 weeks prior to the decline beginning. I would expect that the downside in the S&P should commence by mid to late September at the very latest. The stochastics have been declining for the past month albeit a gentle slope. Figure 8 shows the S&P chart with MA's and MACD. The 50 day MA is above the 200 day MA suggestive of a significant rally coming after the decline. There will be significant resistance around the 900 level. Last weeks Elliott Wave chart showed an expected bottoming in the wave structure to around 790-830. The MACD has the slower MA above the faster MA (bearish) and both are butting against the longer-term downtrend line. If the S&P does drop below its 200 day MA, then that spells for a sharp rally to follow. Currently though, three of the four indicators shown are bearish.
Figure 7. S&P 500 chart with Bollinger bands and full stochastics.
Figure 8. S&P 500 chart with moving averages and MACD.
Figure 9 shows the Elliott Wave Count of the S&P 500. The S&P is expected to be in a tight trading range, with two possible counts possible. The preferred and alternate counts have the same degree of confidence, so it is uncertain which is occurring here. The technicals suggest downside, but the market is advancing on low low volume. Currently the DOW smashed above its June high. It will be interesting to see how this transpires, as it has not been confirmed by the S&P 500 index. It will be interesting to see how the S&P pattern develops, because technicals are pointing to downside, yet it is not occurring. Best to sit tight on these markets right now, as upside is very very limited.
Figure 9. Elliott Wave Analysis of the S&P 500 Index.
Summary
The USD and S&P are in a sideways motion right now, with the S&P having a decline set to occur from mid to late September and the US decline to start sometime in October. The USD count I have would be invalidated with a move above 97.4. Currently the USD is having one heck of a strong move, the S&P 500 is still under 1000, and yet to confirm the DOW's advance above its former high placed in June, bonds are retracing their move down, gold correcting etc. etc. The current trading climate is a lot to handle for everyone as the number of variables and their complexities keep growing. Any advance in the stock markets is a short-term blip prior to more downside. Everyone knows the fundamentals of the market are dire, money supply expanding etc. The patterns go up and they must go down......I must say though, the current strength in the DOW and S&P 500 indices has been surprising to say the least.


