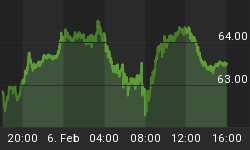
Oil, gold, and the agricultural commodities are experiencing some serious selling pressure for a change, as reflected by the charts through Tuesday. First let's have a look at the DBA (Proshares Agricultural Commodity, ETF).
This is what I wrote about the DBA last Thursday: From my experience with near-vertical price moves, the DBA has arrived at the point of "the curve" that requires the price structure either to start a series of up-gaps in a classic blow-off move, or will have to consolidate and pullback prior to another upleg. As far as I am concerned, there is no middle ground. For the time being, key near-term support resides at 41.00, which if violated and sustained should trigger a nasty bout of long liquidation that presses the price structure towards 36.00-35.50. Conversely, an upside penetration of 43.50 could trigger the classic blow-off that frequently accompanies -- and the exhausts -- patterns that resemble the DBA.
Let's notice that the DBA price structure has plummeted (likely profit-taking in the aftermath of such an enormous advance), and is threatening key near-term support at 41.00, which if violated and sustained should trigger more long liquidation of entrenched holders of agricultural commodities -- that presses the DBA towards 38.00 next.

As for gold, in our 10 am posting to subscribers on Monday we discussed the powerful up-gap opening in the streetTRACKS Gold Shares (NYSE: GLD) and the fact that the GLD had hurdled the resistance line of its multi-month bullish price channel. We wrote: "This is very interesting action in the GLD -- to see if the up-gap up here can be preserved?[and] to see if the GLD can hold above its upper channel line (96.67) because usually a thrust above the upper channel concludes the underlying upleg."
Forward fast to Tuesday's action and what we find is that 1) yesterday's up-gap has been more than filled completely, and 2) the GLD has reversed significantly back below the upper channel line, thereby suggesting to me (technically) that indeed a significant near-term peak has been established at yesterday's high of 97.74. My initial downside target is 93.75 to 92.70 in the GLD.

Finally, looking at oil, crude oil prices were down on Tuesday; however, natural gas prices rose. Let's notice the difference between the patterns in the US Oil Fund (AMEX: USO) and US Natural Gas Fund (AMEX: UNG). The former has been in a roaring uptrend for the entire year, while the latter has just recently emerged into a powerful uptrend from the confines of a 7-month base pattern.
The USO pattern exhibits characteristics of an upleg that is peaking (or has peaked), while the UNG exhibits a pattern that is in the major thrust of its upside potential. It is with that in mind that I remain short the USO in our model portfolio and long the UNG.


