"No warning can save people determined to grow suddenly rich" - Lord Overstone
 |
Gold •748 days | 2,368.70 | +35.30 | +1.51% |
|
Platinum •14 mins | 1,640.70 | +36.70 | +2.29% |
|
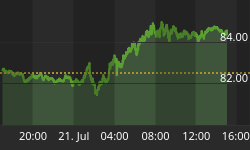
WTI Crude •11 mins | 84.55 | +2.07 | +2.51% |
|
Gasoline •11 mins | 3.402 | +0.013 | +0.37% |
|
Ethanol •748 days | 2.161 | +0.000 | +0.00% |
|
Silver •748 days | 30.82 | +1.16 | +3.92% |
 |
Silver • 748 days | 30.82 | +1.16 | +3.92% | |
|
Copper • 748 days | 4.530 | +0.111 | +2.51% | |
|
Brent Crude • 10 mins | 91.32 | +2.10 | +2.35% | |
|
Natural Gas • 11 mins | 2.892 | +0.032 | +1.12% | |
|
Heating Oil • 10 mins | 4.130 | +0.011 | +0.28% |
Charles Meek

Contributor since: 26 Feb 2010
Biography
Mr. Meek is a Registered Investment Advisor and editor of MeekMarketModels.com.
-
Update on Metals, KRY, USEG
Dow Jones Industrial Average 10,634 Value Line Arithmetic Index 1,900 30-Year Treasury Index 4.39% Gold 1/10 Ounce $44.82 The Big Picture for Stocks The 4-year…
-
Four-Year Cycle Update
Dow Jones Industrial Average 10,487 Value Line Arithmetic Index 1,882 30-Year Treasury Index 4.30% Gold 1/10 Ounce $44.2 The Big Picture for Stocks The cycle…
-
Buy China Energy Technology
Dow Jones Industrial Average 10,558 Value Line Arithmetic Index 1,864 30-Year Treasury Index 4.41% Gold 1/10 Ounce $44.34 The Big Picture for Stocks The 4-year…
-
Money Tight Yet?
Dow Jones Industrial Average 10,302 Value Line Arithmetic Index 1,811 30-Year Treasury Index 4.30% The Big Picture for Stocks The 4-year cycle is negative into…
-
Ducks of the Dow Update
Dow Jones Industrial Average 10,274 Value Line Arithmetic Index 1791 30-Year Treasury Index 4.22% The Big Picture for Stocks The bull market phase of this 4-year cycle is…
-
Buy Prudent Bear Income Fund
Dow Jones Industrial Average 10,623 Value Line Arithmetic Index 1,814 30-Year Treasury Index 4.37% The Big Picture for Stocks The 4-year cycle for stocks is negative into 2006.…
-
Rally Over?
Dow Jones Industrial Average 10,461 Value Line Arithmetic Index 1761 30-Year Treasury Index 4.28% The Big Picture for Stocks The 4-year cycle would have the…
-
Buy Signal
Dow Jones Industrial Average 10,158 Value Line Arithmetic Index 1,669 30-Year Treasury Index 4.58% The Big Picture for Stocks: Expect a short term bounce within…
-
Short vs. Long Term Outlook
Dow Jones Industrial Average 10,087 Value Line Arithmetic Index 1651 30-Year Treasury Index 4.63% The Big Picture for Stocks: The 4-year cycle looks negative into…
-
TPE, CSPLF. IJR
Dow Jones Industrial Average 10,785 Value Line Arithmetic Index 1,759 30-Year Treasury Index 4.64% The Big Picture for Stocks The 2002-2004 bull market is probably…
-
Gold, Politics, and Debt
Dow Jones Industrial Average 10,784 Value Line Arithmetic Index 1775 30-Year Treasury Index 4.83% The Big Picture for Stocks: We are looking for the bear side of the…
-
Economic Problems Solved In a Comprehensive Strategy
The administration has a great opportunity to, in one fell swoop, solve (a) the deficit problem (b) the Social Security problem, and (c) the income…
-
Stock Market, Sentiment, and Trend
Dow Jones Industrial Average 10,543 Value Line Arithmetic Index 1732 30-Year Treasury Index 4.82% The Big Picture for Stocks: As to the 4-year cycle, the…
-
One-Day Reversal
Dow Jones Industrial Average 10,549 Value Line Arithmetic Index 1715 30-Year Treasury Index 4.84% The Big Picture for Stocks The bull market is mature. Technical…
-
Sector Analysis/Financial Stocks
Dow Jones Industrial Average 9757 Value Line Arithmetic Index 1565 30-Year Treasury Index 4.76% The Big Picture for Stocks We're most likely in the bear…
-
All Trends Down
Dow Jones Industrial Average 10,005 Value Line Arithmetic Index 1588 30-Year Treasury Index 4.90% The Big Picture for Stocks The 2002-2004 bull market is probably…
-
Continued Caution Advised
Dow Jones Industrial Average 10,205 Value Line Arithmetic Index 1576 30-Year Treasury Index 4.87% The Big Picture for Stocks The bull market of 2000-2004 is…
-
Worst Case Scenario
Dow Jones Industrial Average 9962 Value Line Arithmetic Index 1511 30-Year Treasury Index 5.17% The Big Picture for Stocks The 2002-2004 bull market appears to…
Sign up to the
Safehaven Market Insider


