It’s been a rollercoaster end to a decidedly downbeat 2018 for U.S. stock markets, with stocks posting a series of upside and downside intraday reversals in the month of December and traders frequently caught out by the markets’ sharp swings.
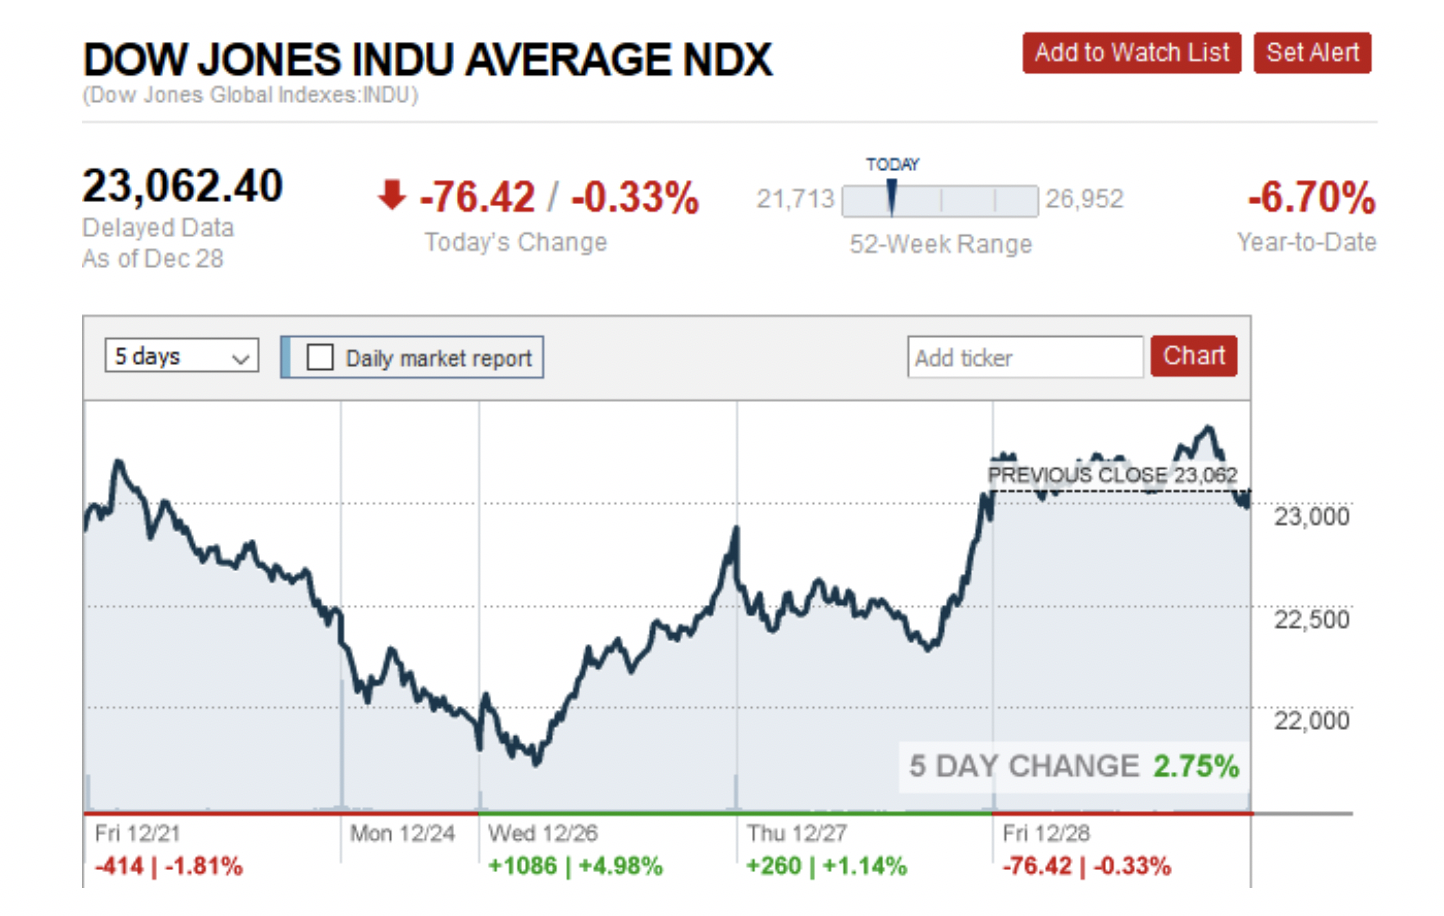
This heightened volatility was underscored by the holiday-shortened week, with major indexes falling more than two percent to post their biggest Christmas Eve drop before staging a major recovery to log their biggest post-Christmas gain in history.
At this juncture, the bulls are desperately waiting for the market to return to less volatile price swings and hope that U.S.-China trade negotiations, a more accommodative Fed policy and upbeat corporate earnings/economic data will help kickstart the markets from their swoon.
It might take a few months for these variables to flesh out and trigger a sustained rally in the new year.
Bear Market Beckons?

(Click to enlarge)

(Click to enlarge)

(Click to enlarge)
Source: CNN Money
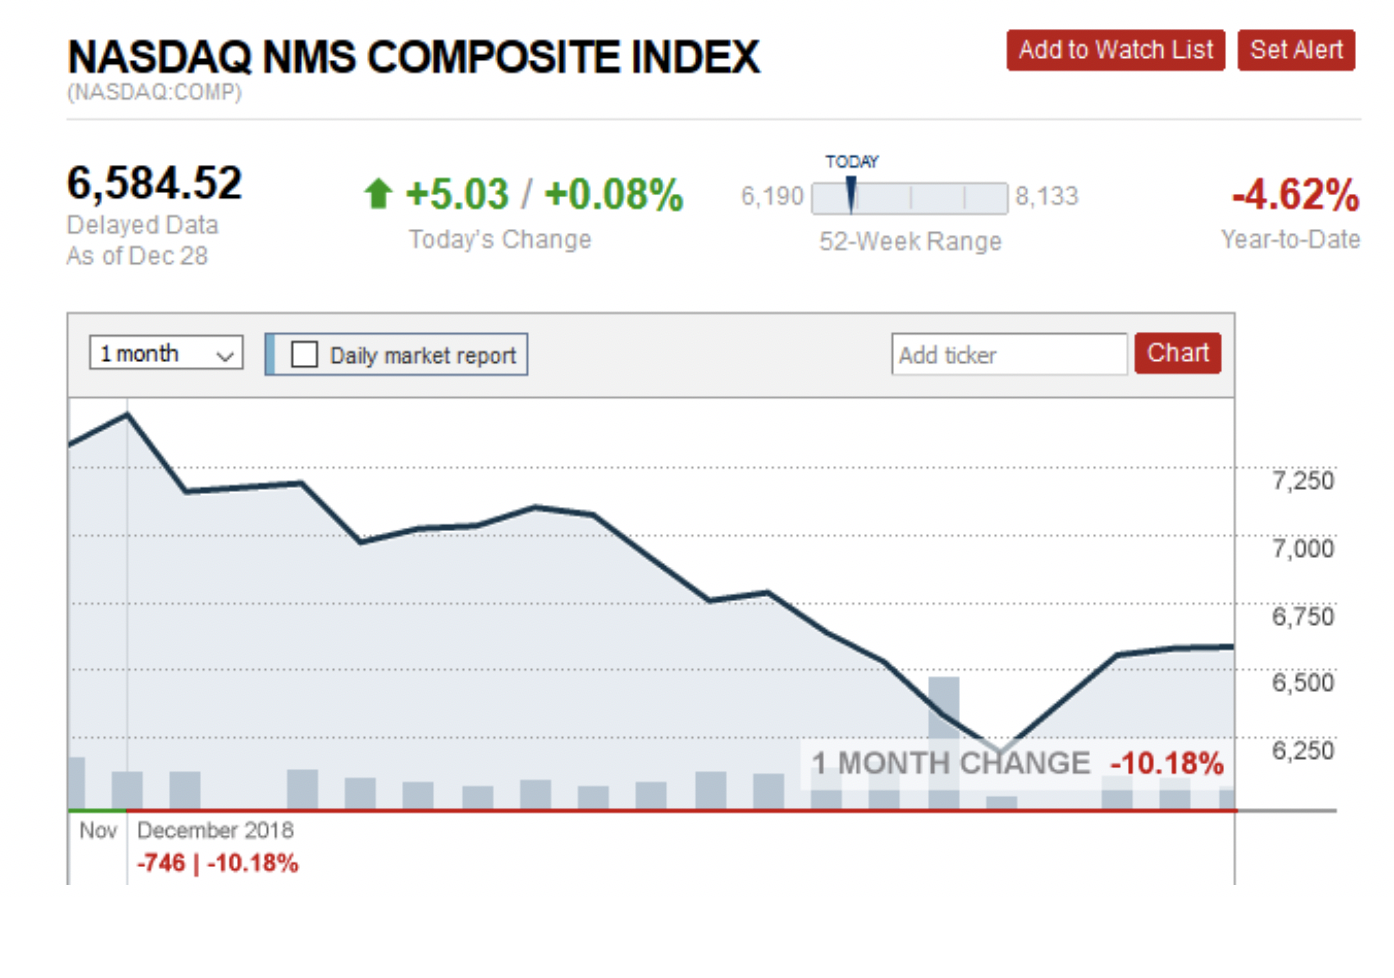
Amid all this back and forth, all major indexes have moved from the green to the red in the final month of the year and looking to cross the tape in deep negative territory.
The S&P 500 Index (SPX) has cratered 9.9 percent over the past 30 days for a year-to-date return of -7 percent.
The Dow Jones Industrial Average (INDU) has dropped 9.7 percent over the past month for a -6.7-percent YTD return, while the tech-heavy Nasdaq Composite (COMP) is flashing a 30-day return of -10.2 percent and -4.6 YTD.
The dramatic end-of-year contraction officially ushered in a bear market after the S&P 500 fell more than 20 percent below intraday highs set on Sept. 21.
While the latest monster rally offers bulls some hope that the trend could reverse, a section of Wall Street warns that it would take an extended upward move for that to happen.
That view is further reinforced by the fact that the U.S. economy has been in the expansion phase for 37 quarters now, the second-longest in history.
We are in the early throes of a late-cycle, one that’s emblematic of an overheated economy poised to slip into a full-blown recession. During this stage, economic growth rates slow to stall speed against a backdrop of tightening credit availability, restrictive monetary policy and deteriorating corporate profit margins.
The performance of economically sensitive assets such as stocks tends to be strongest during the early-cycle before moderating and eventually declining during the late-phase and recession. In contrast, more defensive assets such as Treasury bonds typically enjoy their highest returns during down years for stocks.

(Click to enlarge)
Source: RBC Wealth Management

(Click to enlarge)
Source: Fidelity Investments
To counteract the “aging bull market” view, it’s worth noting that economic cycles do not simply die of old age.
Economic growth during the current expansion cycle has been far from robust, averaging 2.2 percent and well below the long-term average of 3.3 percent. That actually marks it as the weakest expansion since WWII.
Further, although the consensus is that we are in a late-cycle, real evidence actually supports the view that we are straddling a mid-and late-cycle. For instance, GDP growth during the second quarter clocked in at blistering 4.2 percent, the fastest in four years, and an above-average 3.5 percent during the third quarter. Although the economy is expected to slow down in 2019, decent growth is still expected over the next two years.
Sector Performance
Stock market performance by the 11 sectors of the U.S. economy has been mixed with a strong performance by the healthcare, utilities, consumer discretionary and information technology sectors offset by a weak showing by communications, materials, industrials, financial and energy sectors.
Here’s a rundown of how the different sectors have performed in 2018:
#1 Communication Services
Market Cap: $4.1T
Market Weight: 10.3%
YTD Returns: -16.7%
Industries:
- Diversified Telecommunication Services
- Entertainment
- Interactive Media & Services
- Media
- Wireless Telecommunication Services
The Communication Services sector is made up of companies that provide communications services through fixed-line, wireless, cellular, high bandwidth and/or fiber optic cable network. The sector is mostly neutral during the mid-and late-cycles but tends to consistently outperform during recessions.
#2 Consumer Discretionary
Market Cap: $4.28T
Market Weight: 10.8%
YTD Returns:-1.56%
Industries:
- Auto Components
- Automobiles
- Distributors
- Diversified Consumer Services
- Hotels, Restaurants and Leisure
- Household Durables
- Internet and Direct Marketing Retail
- Leisure Products
- Multiline Retail
- Specialty Retail
- Textiles, Apparel and Luxury Goods
The Consumer Discretionary sector encompasses industries that tend to be the most sensitive to economic cycles. The sector tends to strongly underperform during the late business cycle phase. Related: Dow Jones Surprises Market With Largest Single-Day Gain In History
The Internet and Direct Marketing Retail Industry has been a standout performer with 24.9 percent YTD return.
#3 Consumer Staples
Market Cap: $3.13T
Market Weight: 7.9%
YTD Returns:-11.5%
Industries:
- Beverages
- Food and Staples Retailing
- Food Products
- Household Products
- Personal Products
- Tobacco
The Consumer Staples Sector comprises companies that are less sensitive to economic cycles. The sector tends to be neutral during the mid-cycle; outperforms during the late-cycle and consistently outperforms during recessions. Virtually all industries in the sector are in red territory.
#4 Energy
Market Cap:$3.05T
Market Weight: 7.7%
YTD Returns: -20.7%
Industries:
- Energy Equipment & Services
- Oil, Gas and Consumable Fuels
Companies in the Energy Sector are engaged in the exploration, production, refining, marketing and transportation of oil and gas products, coal and other consumable fuels. The sector is mostly neutral in the mid-cycle, consistently outperforms in the late-cycle and returns to neutral mode during recessions. Energy has been the S&P 500’s worst performing sector mainly due to a collapse in oil prices.
#5 Financials
Market Cap: $6.32T
Market Weight: 15.9%
YTD Returns:-15.5%
Industries:
- Banks
- Capital markets
- Consumer Finance
- Diversified Financial Services
- Insurance
- Mortgage REITs
- Thrifts & Mortgage Finance
Financial Sector companies engage in banking, mortgage finance, investment banking, asset management, consumer finance, corporate, lending, financial investment, real estate investment trusts(REITs) and real estate management & development. The sector tends to outperform in the early-stage business cycle but tends to be a mixed bag in the other three phases. The sector has had a year to forget with nearly all industries suffering double-digit declines.
#6 Healthcare
Market Cap:$5.05T
Market Weight: 12.7%
YTD Returns: 3.26%
Industries:
- Biotechnology
- Healthcare Equipment & Supplies
- Healthcare Technology
- Life Sciences Tools and Services
- Pharmaceuticals
In a sea of underperforming sectors, the healthcare industry has been a monolith of performance and one of the few sectors still in the green after the carnage. The sector tends to consistently outperform during the late-cycle and recessions though political rhetoric surrounding the Affordable Care Act is expected to continue fueling volatility.
#7 Industrials
Market Cap: $3.48T
Market Weight: 8.8%
YTD Returns: -15.8%
Industries:
- Aerospace & Defense
- Air Freight & Logistics
- Airlines
- Building Products
- Commercial Services & Supplies
- Construction & Engineering
- Electrical Equipment
- Industrial Conglomerates
- Machinery
- Marine
- Professional Services
- Road & Rail
- Trading Companies & Distributors
- Transportation Infrastructure
Companies in the Industrial Sector tend to perform well during the early-and mid-business cycle, turn neutral in the late-cycle and consistently underperform during recessions. Although global manufacturing activity remains positive, growth rates have slowed down with trade tensions between the U.S. and China taking a toll.
#8 Information Technology
Market Cap: $6.27T
Market Weight: 15.8%
YTD Returns: -2.5%
Industries:
- Communications Equipment
- Electronic Equipment, Instruments & Components
- IT Services
- Semiconductors & Semiconductor Equipment
- Software
- Technology Hardware, Storage and Peripherals
At nearly 25% of the S&P 500, the IT sector is the market’s largest component. After strong performance during the first half of the year, the sector tanked nearly 20% during the final three months of the year and now lies in negative territory.
Related: New Regulations Could Boost Lagging Solar Growth
The Software industry though is still up 15 percent in the year-to-date while Communications Equipment has gained 10.4% over the timeframe. The sector tends to perform well during the early and mid-cycle but consistently underperforms during the late-cycle and recessions.
#9 Materials
Market Cap: $1.68T
Market Weight: 4.2%
YTD Returns: -17.1%
Industries:
- Chemicals
- Construction Materials
- Containers & Packaging
- Metals & Mining
- Paper & Forest Products
#10 Real Estate
Market Cap: $1.09T
Market Weight: 2.7%
YTD Returns: -5.7%
Industries:
- Equity Real Estate Investment Trusts
- Real Estate Management & Development
The Real Estate sector tends to be a strong performer during the early stages of the business cycle, turns neutral during the mid-and late-cycles and consistently underperforms during recessions. A low-interest environment can make dividend-paying real estate investment trusts(REITs) an attractive proposition, something that has supported the sector for years. However, rising interest rates now threatens to make the sector less attractive; worries about rising inventory seem to be pressuring margins while a shift from brick-and-mortar retailers is making mall REITs less investable.
#11 Utilities
Market Cap: $1.23T
Market Weight: 3.1%
YTD Returns: 0.27%
Industries:
- Electric Utilities
- Gas Utilities
- Independent Power and Renewable Electricity Producers
- Water Utilities
The Utility sector performs poorly during the early and mid stages of the economic cycle; does well during the late stage and consistently outperforms during recessions. The utilities sector has lately been receiving a boost as cautious investors start turning to more defensive sectors. Within the sector, the Independent Power and Renewable Electricity Producers industry has been particularly impressive after logging YTD returns of 33.8 percent.
Gold Outlook

(Click to enlarge)
Source: CNN Money
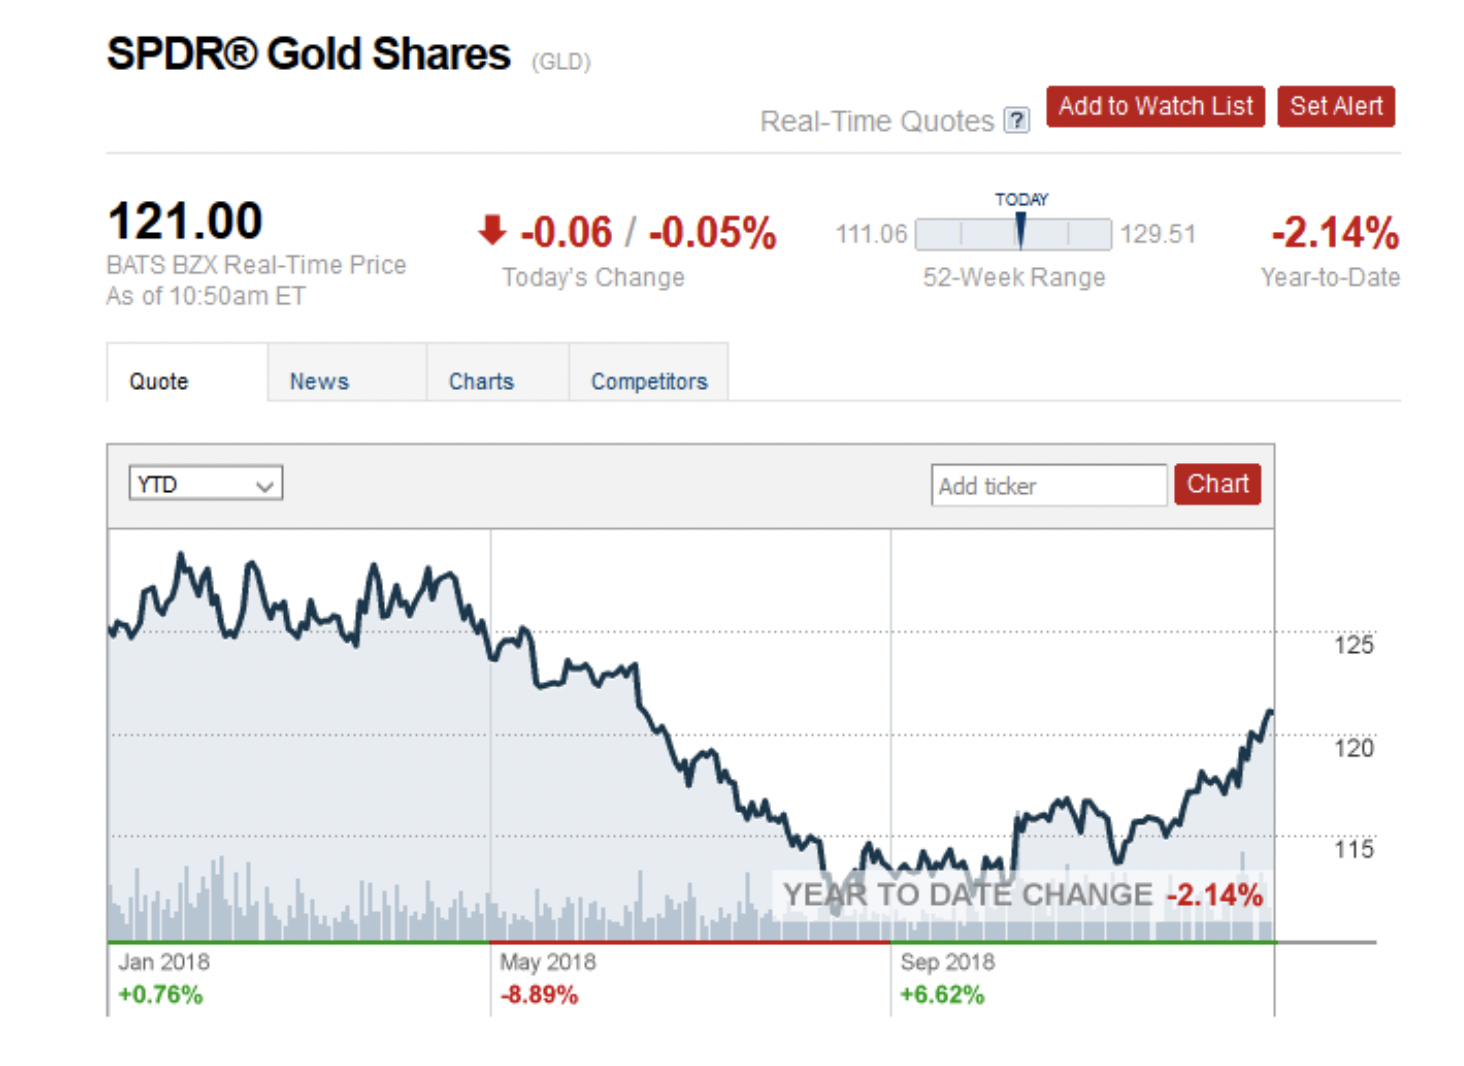
The gold market has been moving sideways for three years now, and both gold bulls and bears are looking worse for wear.
After a sustained decline during the first three quarters of the year, gold prices have been climbing during the final quarter as U.S. dollar stabilizes and investors continue fleeing volatile equities markets and the dollar continues to stabilize.
A big part of that underperformance can be pinned on a brawny dollar. It’s only after the greenback entered a consolidation phase a few months ago that the yellow metal got some reprieve. While the current spot gold price of $1,281.47 per ounce is still 2.8 percent lower than the Jan.1 opening price, it’s a considerable improvement over the 2-year low of $1,175.29 set on Aug. 7.
Gold prices promise to ring in the New Year on a strong note as Main Street investors continue betting that the upward momentum will continue. A good 34 percent of respondents in a recent Kitco survey see gold pushing above $1,500 per ounce by the end of 2019, nearly double the number who expect it to move below $1,100.
Most financial experts, however, only expect prices to grind slightly higher in the coming year.

(Click to enlarge)
Source: Kitco
Bitcoin Outlook
Bitcoin has experienced a particularly turbulent year with the asset’s price plunging to a 52-week low in December. The current price of $3,744.23 is 10.9 percent lower over the past 30 days and a far cry from its Dec. 2017 peak of $19,500.
The market remains very divided about bitcoin’s next move with the bull and bear camps unable to find a find common ground. On one hand is renowned bitcoin strategist and perma-bull Tom Lee who says bitcoin’s fair value is between $13,800 and $14,800, judging by the factors influencing supply including the number of active wallet addresses and average usage per account.
Mr. Lee, however, has nothing on founder of Galaxy Digital and ex-Goldman Sachs billionaire fund manager and, Mike Novogratz who sees BTC zooming back to $20,000. Meanwhile, David Thomas, director and co-founder of GlobalBlock, is a bit more cautious and has forecast a target of $8,000-$10,000 (£6,300-£7,880) for 2019.
On the opposite side of the spectrum is Calvin Ayre, founder of Bitcoin Cash, who expects BTC to plunge to zero within a year because: ‘‘…Bitcoin has now been superseded by more scalable technology.’’ Mr. Cavin, however, remains optimistic about cryptocurrencies in general.
From a purely technical standpoint though, it’s increasingly beginning to look like BTC has found a floor around $3,150. It might, however, take some time before more bulls come on board in sufficient volumes to drive prices above the $4,100 resistance zone and set the pace for a nice rally. And even then, it might take even longer before full confidence is restored after the 2018 bloodbath.
By Alex Kimani for Safehaven.com
More Top Reads From Safehaven.com


