"No warning can save people determined to grow suddenly rich" - Lord Overstone
 |
Gold •734 days | 2,368.70 | +35.30 | +1.51% |
|
Platinum •15 mins | 1,655.10 | +12.00 | +0.73% |
|
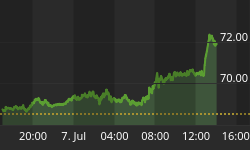
WTI Crude •11 mins | 71.60 | +3.05 | +4.45% |
 |
Gasoline •11 mins | 2.980 | -0.023 | -0.77% |
|
Ethanol •734 days | 2.161 | +0.000 | +0.00% |
|
Silver •734 days | 30.82 | +1.16 | +3.92% |
 |
Silver • 734 days | 30.82 | +1.16 | +3.92% | |
|
Copper • 734 days | 4.530 | +0.111 | +2.51% | |
|
Brent Crude • 11 mins | 75.30 | +3.31 | +4.60% | |
|
Natural Gas • 11 mins | 3.259 | +0.014 | +0.43% | |
|
Heating Oil • 11 mins | 3.346 | +0.047 | +1.43% |
Markets

There May Be a Trade Nearby in Copper
Since we first wrote about it in December, we have been watching a beautiful example of a b-wave triangle develop in copper. In February, it presented traders with a fantastic…
Gold and the Return of Global Turmoil
The last several weeks have seen a return of all the ingredients for a gold rally, from an "oversold" technical condition which sparked a short-covering rally to a spike in…
What Do (Mining) Stocks Tell Us About Gold's Future Moves?
Yesterday, gold stopped a five-day rally that had pushed it to its highest since mid-May, and lost some of its safe-haven appeal as the chance of imminent U.S. military strikes…
Gold Production Decline Imminent
Gold’s precipitous decline in the first half of 2013 sent shockwaves throughout the entire mining industry. Its scary panic-induced 28% plunge over just six months has forced the miners to…
The Unfriendly Skies
As if the federal government were not already doing enough to kill the U.S. airline industry with restrictive workplace rules, over-regulation, and a monetary policy that supports higher fuel prices,…
EUR/JPY: Consolidation Continues
EUR/JPY is performing in a manner that is similar to what we have seen in GBP/JPY. Until the consolidation range between 127.98 and 132.74 (12/08/2013 low and 24/07/2013 high) is…
Not Broken, Just Bent?
It should be noted that stocks have still not reached the 2007 highs, much less the 2000 highs, in real terms (see chart, source Bloomberg: this is just the SP500…
Wal-Mart is Not Costco; So Why Should it Pay Like Costco?
President Obama, the unions, and Democrats in general are attempting to force Wal-Mart to raise its minimum wage. In Seattle, there is an absurd push by activists to raise the…
Gold Silver Ratio
The Gold/Silver ratio is currently just under 58:1. Many have cited that the Gold/Silver ratio should be roughly 16:1. This was an historic level that existed largely prior to 1900…
Relative Strength Indicator: TOP!
Figure 1 is a weekly chart of the SP500. The indicator in the lower panel is a composite that looks at the relative strength of the 9 SP500 sectors: Materials,…
Sign up to the
Safehaven Market Insider


