"No warning can save people determined to grow suddenly rich" - Lord Overstone
 |
Gold •735 days | 2,368.70 | +35.30 | +1.51% |
|
Platinum •10 mins | 1,597.30 | +9.50 | +0.60% |
|
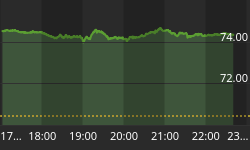
WTI Crude •11 mins | 74.39 | +0.87 | +1.18% |
|
Gasoline •11 mins | 3.122 | +0.018 | +0.59% |
|
Ethanol •735 days | 2.161 | +0.000 | +0.00% |
|
Silver •735 days | 30.82 | +1.16 | +3.92% |
 |
Silver • 735 days | 30.82 | +1.16 | +3.92% | |
|
Copper • 735 days | 4.530 | +0.111 | +2.51% | |
|
Brent Crude • 11 mins | 78.91 | +0.89 | +1.14% | |
|
Natural Gas • 11 mins | 3.212 | -0.053 | -1.62% | |
|
Heating Oil • 11 mins | 3.717 | +0.059 | +1.62% |
Markets

Simon Properties Offers to Buy GGP for $10B, or Just Over $9 Per Share
It appears as if SPG offered a reasonable acquisition premium (in equity) over what we feel is reasonable for GGP. The cash offer was accurate to within eighty cents! It…
Gold in Euros is About to go Parabolic
How can we tell if a market is about to go parabolic? Trendlines are one way. Another way is to look at the length of corrections. How long is it…
UR All PIGS From HELL!
Whether you're in Central Europe, such as Ukraine or Romania, the Med countries such as Portugal, Italy, Greece, Spain, or from Hungary to the Baltic States of Estonia, Latvia or…
Fed Chooses to Exit through Eye of Needle
Ben Bernanke is making sure the Fed's exit strategy goes as easily as a camel can pass through the eye of a needle. Instead of choosing to just sell assets…
Rydex Market Timers: Bearish And More!
The current value of the indicator stands at 0.89 suggesting that the Rydex market timers are bearish, and this is a bullish signal. See the recent strategy piece on how…
Weekend Gold, Silver, Nat Gas and Oil Trading Report
Last week ended on a positive note with stocks and commodities pushing higher into Friday's close. The market overall is looking very unstable here and this week I figure there…
Technically Precious with Merv
The weekly action has been primarily to the up side but still we've gone no place. Since Dec gold has formed a downward sloping wedge pattern which usually breaks to…
Monetary Inflation and the Fed's Exit Strategy
We have always been confident in the collective ability of the US Government and the Fed to perpetuate the inflation of the US money supply. The only question in our…
Redoing the Kitchen While the House Burns Down
Debt, of course, is the fire in this analogy. The U.S. has borrowed more it can ever hope to pay off, and for a country as for a family, when…
Turning Points
By declining to 1044.50, the SPX has retraced almost .382 of its up-phase from July 2009. This was most likely engineered by the bottoming 9-mo cycle at a time when…
Sign up to the
Safehaven Market Insider


