"No warning can save people determined to grow suddenly rich" - Lord Overstone
 |
Gold •721 days | 2,368.70 | +35.30 | +1.51% |
|
Platinum •15 mins | 1,585.80 | +3.90 | +0.25% |
 |
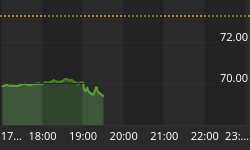
WTI Crude •11 mins | 69.97 | -0.37 | -0.53% |
|
Gasoline •14 mins | 2.873 | -0.009 | -0.29% |
|
Ethanol •721 days | 2.161 | +0.000 | +0.00% |
|
Silver •721 days | 30.82 | +1.16 | +3.92% |
 |
Silver • 721 days | 30.82 | +1.16 | +3.92% | |
|
Copper • 721 days | 4.530 | +0.111 | +2.51% | |
|
Brent Crude • 2 hours | 73.74 | -3.34 | -4.33% | |
|
Natural Gas • 12 mins | 3.230 | +0.009 | +0.28% | |
|
Heating Oil • 1 hour | 3.156 | -0.020 | -0.64% |
Markets

Africa is Hot Destination for Oil Companies Despite Concerns for Transparency
Africa is growing in strategic importance for the US as an alternative to the Middle East as a source of crude. The US already imports more crude from the continent…
Elliott Wave on Copper
Copper is at all time highs, but the question many are asking is, where does it go from here. The first long term chart illustrates that another parabolic advance is…
Turning Points
The year-end rally continued to forge ahead during the past two weeks and the Russell 2000 finally joined the other equity indices in making a new bull market high. The…
EWP on the DOW & S&P 500
The DOW dropped back from a target level. The S&P followed though its target level was a lot higher. Both indexes have started overlapping which is shown by the black…
The Bell Tolls for Gold US$600!
The gold stocks have acted much as I expected on this move to U$500. I expect the HUI to break out when gold prices are ready to move past US$505…
Excerpts From - Global Watch - The Gold Forecaster
Chinese consumers keep buying, despite the rising, exorbitant, retail price of the gold in a market where the premium is way above the international price.
Bernankeism: Fraud or Menace?
While Governor Bernanke is not the only member of the anti-deflation wing at the Fed, the Chair apparent has emerged as the most prominent advocate of this new agenda. His…
After Christmas Sale? - Are You Listening?
So what are you thinking about December 2005/January 2006? You might predict a likely continuation of the rally into year end and then some significant selling starting in January? Hey,…
Copper, Silver and China
While we watch gold, silver and other metals foraging onto new multi-year highs, I thought I would be a good contrarian and indulge in some silver speculation of the thinking…
Moonshine or Strychnine?
Sadly for paper bulls, this long term chart implies a bottom at around 1.00+-, which could mean the S&P and gold will both have a price of 1500, or 500…
Sign up to the
Safehaven Market Insider


