"No warning can save people determined to grow suddenly rich" - Lord Overstone
 |
Gold •723 days | 2,368.70 | +35.30 | +1.51% |
|
Platinum •10 mins | 1,647.30 | +28.50 | +1.76% |
 |
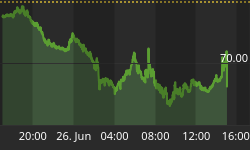
WTI Crude •17 hours | 69.23 | -2.69 | -3.74% |
|
Gasoline •17 hours | 2.957 | -0.070 | -2.32% |
|
Ethanol •723 days | 2.161 | +0.000 | +0.00% |
|
Silver •723 days | 30.82 | +1.16 | +3.92% |
 |
Silver • 723 days | 30.82 | +1.16 | +3.92% | |
|
Copper • 723 days | 4.530 | +0.111 | +2.51% | |
|
Brent Crude • 16 hours | 71.99 | -3.27 | -4.34% | |
|
Natural Gas • 17 hours | 3.279 | -0.016 | -0.49% | |
|
Heating Oil • 17 hours | 3.208 | -0.090 | -2.73% |
Markets

The 'Bloodbath' in Canada Is Far From Over
The oil price crash continues to claim victims...and many of them are in Canada. The price of oil hovered around $100 for most of last summer. Today, it's trading for…
The Root of Gold Conspiracy Theories
Most people who own or trade gold have a higher price in mind, a price determined by what they think the metal is worth in dollar terms. That's normal. However,…
Pound Continues To Lower Levels
GBPUSD fell sharply in the last two trading days which looks like a start of new impulsive leg lower. We labeled end of wave (2) at 1.5500 area so current…
The Scorpio Moon Low
The next Scorpio Moon is due 11/12-13 and we have declined into it, suggesting a 11/13+/-1 Scorpio Moon Low, right at the 11/15 weekend Solar CIT.
Make or Break
The global economy is slowing down rapidly and it is conceivable that the developed world may face a recession next year. Already, the Japanese economy is contracting and even Europe…
Why Hasn't The Fed's QE Caused 'Inflation'?
The Federal Reserve has monetised a few trillion dollars of bonds over the past seven years without creating much in the way of what most people call "inflation" (a rise…
AUDJPY Short-Term Elliott Wave Analysis
Best reading of the Elliott Wave cycle suggests decline to 85.41 ended wave (4). From this level, pair has resumed rally in wave (5) as a double three structure where…
EUR/USD - Breaking The Downtrend Channel
EUR/USD is retracing around 1.0800. Hourly support lies at 1.0675 (10/11/2015 low). Hourly resistance can be found at 1.0897 (05/11/2015 high). The technical structure remains clearly negative. Stronger resistance stands…
A Closer Look at All Those New U.S. Jobs
The mean measure of U.S. personal income peaked in 2006. The median measure shows that half of U.S. citizens are earning less money in real terms than they were in…
US Stock Market: Anatomy of a Correction
Over the last week we (NFTRH) have used market sentiment indicators and index charts to gauge the prospects of finding a high on the post-September relief 'bounce' rally.
Sign up to the
Safehaven Market Insider


