"No warning can save people determined to grow suddenly rich" - Lord Overstone
 |
Gold •728 days | 2,368.70 | +35.30 | +1.51% |
|
Platinum •10 mins | 1,618.40 | +18.50 | +1.16% |
 |
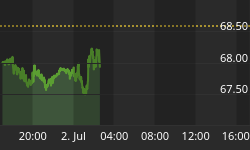
WTI Crude •11 mins | 67.60 | -0.98 | -1.43% |
|
Gasoline •11 mins | 2.904 | -0.041 | -1.41% |
|
Ethanol •728 days | 2.161 | +0.000 | +0.00% |
|
Silver •728 days | 30.82 | +1.16 | +3.92% |
 |
Silver • 728 days | 30.82 | +1.16 | +3.92% | |
|
Copper • 728 days | 4.530 | +0.111 | +2.51% | |
|
Brent Crude • 11 mins | 70.58 | -0.99 | -1.38% | |
|
Natural Gas • 11 mins | 3.176 | -0.044 | -1.37% | |
|
Heating Oil • 11 mins | 3.217 | -0.001 | -0.04% |
Markets

Bitcoin Trading Alert: Bitcoin Stays below $250
In short: no speculative positions. Barclays is interested in the Bitcoin technology and has partnered with a Bitcoin exchange to explore blockchain technologies ...
The Movement on the NYA Index
Last week, we posted a chart of the NYA Index, and today we are posting the update of that chart. When you look at the chart, you will clearly see…
Three Charts That Convey A Lot Of Information About The Stock Market
The chart below shows the 2000 peaking process in the NASDAQ. The index made a lower high, a lower low, and then dropped below the 50-day moving average shown in…
Euro Bourses and Euro Currency's Inverse Relation Still In Play
The euro-Dax-bunds relationship continues in full swing, led by a rallying Dax (and rest of Eurozone bourses) resulting from the most notable steps taken by Greece towards reaching a deal…
Dow Decline
Equities markets have a tendency to change direction following options expiration. Given equities rallied into the end of last week, a downturn can now be expected. It may have started…
Paul Brodsky Talks Financial Repression
Its easy to think there is a grand conspiracy out there is terms of the banking system, the policy makers and politicians in the political dimension. It is very easy…
Interest - Inflation = #REF
Some economists assert that the interest rate you see on the Treasury bond is not real. You see, it's only nominal. To calculate the real rate, they say you must…
GBP/JPY - Consolidating
GBP/JPY is consolidating below 195.84 (year high). Hourly support is given at 188.98 (10/06/2015 low). Key resistance is given at 197.45 (26/09/2008 high). There is no downside pressure at the…
EURJPY Short-Term Elliott Wave Analysis
Current short term Elliott wave view suggests rally from 1.5169 is unfolding in a double correction structure W-X-Y where wave W ended at 1.5554 and wave X ended at 1.5419.…
Skeptical Sentiment In A Sideways Market: Bullish Or Bearish For Stocks?
As shown in these charts, the S&P 500 has made very little progress over the past five months. It seems logical the longer stocks "go nowhere", the more skeptical investors…
Sign up to the
Safehaven Market Insider


