


5/25/2008 11:18:37 AM
It's been a tough year, for the markets and for us - here's where we stand.

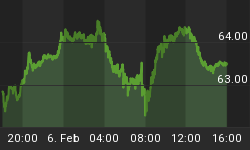
Stock Barometer Analysis
The barometer remains in Sell Mode.
The Stock Barometer is my proprietary market timing system. The direction, slope and level of the Stock Barometer determine our outlook. For example, if the barometer line is moving down, we are in Sell Mode. A Buy or Sell Signal is triggered when the indicator clearly changes direction.
Stock Barometer Cycle Time
Tuesday will be day 3 in our down cycle.
The Stock Barometer signals follow 5, 8, 13, 21 and sometimes 34 day Fibonacci cycles that balance with 'normal' market cycles. Knowing where you are in the current market cycle is important in deciding how long you expect to maintain a position.
Potential Cycle Reversal Dates
2008 Potential Reversal Dates: 12/31, 1/11, 2/1, 2/13, 3/6, 4/5, 4/22, 5/23, 6/6. We publish these dates up to 2 months in advance.
The market moved lower into our 5/23 key reversal date. This may mean that the market will be moving higher into 6/6.
My Additional timing work is based on numerous cycles and has resulted in the above potential reversal dates. These are not to be confused with the barometer signals or cycle times. However, due to their past accuracy I post the dates here.
2007 Potential Reversal Dates: 1/10, 1/14, 1/27, 1/31, 2/3, 2/17, 3/10, 3/24, 4/21, 5/6, 6/15, 8/29, 10/19, 11/29, 12/13, 12/23, 12/31, 1/11/08. 2006 potential reversal dates: 1/16, 1/30, 2/25, 3/19, 4/8, 5/8, 5/19, 6/6(20), 7/24, 8/20, 8/29, 9/15, 10/11, 11/28. 2005 Potential reversal dates based on 'other' cycle work were 12/27, 1/25, 2/16, 3/4, 3/14, 3/29, 4/5, 4/19, 5/2, 6/3, 6/10, 7/13, 7/28, 8/12, 8/30-31, 9/22, 10/4, 11/15, 11/20, 12/16.
The following work is based on my spread/momentum indicators for the QQQQ, GLD, USD, USO and TLT. They are tuned to deliver signals in line with the Stock Barometer and we use them only in determining our overall outlook for the market and for pinpointing market reversals. The level, direction, and position to the zero line are keys in these indicators. For example, direction determines mode and a buy signal 'above zero' is more bullish than a buy signal 'below zero'.
QQQQ Spread Indicator (NASDAQ:QQQQ)

The QQQQ Spread Indicator will yield its own buy and sell signals that may be different from the Stock Barometer. It's meant to give us an idea of the next turn in the market.
Gold Spread Indicator (AMEX:GLD)

To trade Gold, utilize the Gold ETF AMEX:GLD. This gives us a general gage to the overall health of the US Economy and the markets, as well as to assists us in the entry of positions in our stock trading service.
US Dollar Index Spread Indicator (INDEX:DXY)

To trade the US Dollar, I'd utilize the Power Shares AMEX:UUP: US Dollar Index Bullish Fund and AMEX:UDN: US Dollar Index Bearish Fund.
Bonds Spread Indicator (AMEX:TLT)

To trade Bonds, I recommend Lehman's 20 year ETF AMEX:TLT. Note that the direction of bonds can have an impact on the stock market. Normally, as bonds go down, stocks will go up and as bonds go up, stocks will go down.
OIL Spread Indicator (AMEX:USO)

To trade OIL, utilize AMEX:USO, the OIL ETF. We look at the price of oil as its level and direction can have an impact on the stock market.
Supporting Secondary Indicator

I monitor over a hundred technical indicators, some that are widely followed and some that are proprietary. These indicators break down the market internals, sentiment and money flow and give us unique insight into the market. I feature at least one here each day in support of our current outlook - and to give you an education on what professional traders utilize.
Summary of Daily Outlook
We remain in Sell Mode as the market moved lower into our 5/23 key reversal date.
Does that mean that the market will be moving higher here? It very well could. We'll be monitoring for a quick reversal back into Buy Mode.
One wild card in the marrkeets here is bonds. Bonds are pressuring support and if they break lower, rates could be going up. This may actually be better than expected, as it may support the dollar and reverse gold and oil. So stay tuned for an interesting week to come!
Sorry for the delay in providing performance information. It's been a tough year for the markets (Q's down almost 6%) and a tough year for us (Down 10.9% in our Rydex Service. But we've been here before - in fact, in some of our best years, we were still negative in May. But as they always say, past performance does not guarantee future performance.
Here's a chart of the Q's with this years' trades so far. There's a lot of information on it, so here's what it all means. The short red and blue lines are the evenings we issued buy and sell signals in the Rydex and QQQQ Trader Services. DSB readers get these signals the following morning. The think light red lines are our key reversal dates that we provide at the beginning of the year in our annual forecast.

Long story short, we use an always in system, which means we're either long or short the market unless we actually close a trade, which we did once this year. That would be noted by a short black line.
As you get the daily stock barometer charts, you'll see it's basically a line that as it moves up and down, we move into buy and sell mode. Sometimes there's noise (brief changes in direction) and we've established a set of rules that allow us to handle that noise. That's where the system has a subjective component. We try to eliminate the subjectivity of the system, but at the end of the day, we do slip up. That's why we provide the signals to you daily - as most use the signals to fuel their own systems.
I'll run through the big issues we've had so far.
The first trade signal of the year, ¼ wasn't a bad signal, but it was delayed by 4 days. I normally don't delay things that long - but we gave credence to a wide support and resistance band that had set up in 2007 and when it broke below that resistance, we had to go short. We could have easily seen double digit profits from that first trade.
On 1/14, we got an initial buy signal after the market has established a narrow support and resistance zone. Our rule is to wait for the market to break resistance before entering buy mode. We were impatient, wanted to book some profits and went into buy mode early. That not only cost us 5.3%, but it took us out of our first trade, which had we followed our rules to a t, would have definitely yielded in excess of 10%, maybe even 20%.
What followed after that period was a wide consolidation that our system doesn't do well with regardless. Remember, you can design a system for short, intermediate and long term time frames. The DSB system will generally produce a series of small profit and losses during this period as the market builds energy for the next larger move, which came with our 3/12 signal, generating over 12.9% in gains.
Unfortunately, that was our best trade all year.
What followed was a series of 3 out of 4 losses. And while the system is designed to have losses, the each day that there's a delay moves profit into the loss category. There were two such occasions in that following period. At the end of the year, it all adds up - so a percentage here and there is a big deal.
Here's the chart with the date for the Qs and the Rydex. Note that we're entering the Rydex positions at the close on the day following the signal. (Note there are services that track us that use the am pricing - we don't promote the use of the am pricing). Same on the Qs - you can enter in the am at the open, but you're better off entering at the close on the following day - or if you can trade during the day, best to enter at the 9:20 pivot - for you day traders.
Historically speaking, we've been here before. In 2004 and 2005 we were negative early in the year and even as late as March and May before finishing with some of our best gains ever. 2006 was just a bad year for me as I dealt with a divorce, the death of an 18 year old nephew and the death of my father. Granted, that shouldn't impact a system. But the biggest impact on the system is trend recognition and the depth of the range. 2007 was a flat year well into October, so we switched to following signals on every change in direction to take the trend, support and resistance modes out of play. That obviously worked against us as the market again entered a year end trend. So instead of having a few profitable trades, we had 13 trades that lost over 31%. Not a great way to end the year.
That being said, we're back to the way things should be and if you have a question about any one of my signals, please do not hesitate to challenge me and I will explain it in more detail in my following articles.

If you have any questions or comments, email me at Jay@stockbarometer.com.
Regards,


