


"The English masses are lovable: they are kind, decent, tolerant, practical and not stupid. The tragedy is that they are too many of them, and that they are aimless, having outgrown the servile functions for which they were encouraged to multiply. One day these huge crowds will have to seize power because there will be nothing else for them to do, and yet they neither demand power nor are ready to make use of it; they will learn only to be bored in a new way." ~ Cyril Connolly, 1903-1974, British Critic
One is almost tempted to state that everything that could possibly go wrong has gone wrong. Just when it looked like the markets were ready to stabilise and had priced in what appeared to be all the negative news the Dow spikes down and trades below it Jan 08 lows. Before we go to examine this potentially explosive pattern lets look at few other factors first.
We had stated before that there was some 2 plus trillion dollars sitting in money market accounts; this money is held by undecided investors who for now have decided to sit out the markets. These chaps have now been further spooked and so it will take a bit of time for them to calm down and to look at the possibility of venturing into the markets. By being further spooked we mean that instead of looking for sectors in the financial markets to deploy money into they have decided to continue sitting on the sidelines.
To make matters worse we feel that these same problems have spilled over to big institutional investors especially the massive sovereign funds and as such even more purchasing power has been temporarily knocked out of the markets. Once key psychological levels are penetrated it has a negative effect on the psyche of most investors.
If we move on and take a look at the 2 year chart of the Dow transports we notice that it pulled back almost all the way to its first break out point back in Oct of 2006; the fact that this zone held is a strong positive for the first break out point usually provides a zone of very strong support and if it is broken easily its not a very good omen. As we write this report the Transports are up over 250 points and in part this surge has to do with the fact that oil has pulled back over 8 dollars in just two days.

The negative factor here however is that the main new up trend line has been violated and the transports will need to surge past 5250 for 18 days to be in a position to re establish this up trend line. The fact that it broke its up trend line after putting in a new high is a positive for if it had done this before putting in a new high it would have been a very negative and dangerous development. The transports ideally should not break below 4600 for more than 6 days in a row; for if they do it would indicate two things
- That the oil markets are still not ready to mount a meaningful correction
- That the Dow will probably break below the 11000 barrier and probably trade as low as the 10650 to 10800 ranges before stabilising.
In terms of oil there are some positive developments for the market; almost all the major stocks in the oil sector have suddenly experienced rather rapid break downs. One could almost say it appears that they are already pricing in lower oil prices; look how fast APA, BPT, XOM, PBR, YPF, etc have broken down in the last few days. If one couples this with the fact that Iran is now hoarding millions and millions of barrels of oil in tankers for potentially higher prices; it leads one to believe that a top at least an intermediate top is close at hand. Mass psychology states that when a market has experienced a massive run up and then big institutions start to either load up shares or hoard up on the stated commodity some sort of top is close at hand. Governments and large institutions are notorious for jumping in towards the end of a run. If we also add in the increased amount of speculation going on in the oil futures markets and the many pundits coming out and sating that one should buy oil on all dips we feel that the likelihood for a pull back is pretty close at hand. If this should transpire it will have a huge positive impact on world wide markets.

Taking a look at the two year chart of the utilities we see that it is the only one out of the transports and Dow industrials that has not broken below its main up trend line. Now this is very important and you might want to know why we feel this way. Firstly according to the TI Dow pattern (do not confuse this with the Dow Theory which is something completely different), it is the utilities that start of the whole process. In other words they have to go on to put in new highs before the other two indices will follow. Hence it makes sense that if this leader breaks down than it will be bad news for the other two. Given the huge sell off it has held up remarkably well and is trading well above its long term up trend line. Technically it could trade all the way down to 460 which would mean a break of the main up trend line but if it did this and was able to trade above the main up trend line within 9 days then we have nothing to worry about. The chances of it testing the bottom of the channel formation at 460 are less than 40% right now. Another bullish factor is that it has not broken below the top of the current channel formation (495-515 ranges) despite the massive sell off in the markets.

The Dow has the ugliest pattern of all; a normal controlled correction suddenly gave way to a rapid fire pull back that drove the Dow all the way to a low of 11100. The Dow easily broke below its main up trend line and in doing so established a new down trend line. It also traded below the Jan 08 lows a bit too fast and easily for our liking; this zone should have provided some resistance but it offered at most a token amount of resistance before breaking down. The somewhat good news is that the Dow is now massively oversold; we have 4 down trend lines in place, all the TA indicators are now in the oversold to extremely oversold ranges and it is now sitting on its two year break out point (roughly 11200) and so far this zone appears to be holding.
For the situation in the Dow to change significantly it will need to first break past 11400 and trade past this zone for at least 9 days in a row. The next stage will be the need for it trade past 12000 for 6 days in a row; if it can do this it has a very good chance of breaking past the new down trend line (12800) and re establishing a new up trend line.
Now the decisive break below its Jan 08 lows has altered the pattern and there is now a possibility that the next rally might be one in which we will have to sell into and close out a lot of our positions except for key holdings. Why the change of heart? Well we are not individuals that sit down and hold onto a decision regardless of what the markets are saying. While we have remained bullish in many trying situations we will not simply remain bullish just because our pride dictates it or because our ego's are too big to adjust our views. We try our very best not to get emotionally attached to the markets or to judge them on an emotional and subjective manner and if the pattern changes then we will adjust our views accordingly to what the market is telling us. We cannot and never will be in a position to tell the market what to do. We can only attempt to read what it is saying currently and then use this info to determine what it might do in the future. We have successfully predicted the market direction correctly on many occasions but we are not foolish or stupid enough to believe that we can always get it right; no one can and anyone that claims to is a bigger fool then those who believe him or her.
Now we are not saying that we will have to sell into the upcoming rally but there is a strong possibility that we might have to close many of our positions. If we are wrong we can always re open these positions later on. For now though we are on standby for the Jan 08 lows were violated too easily and the Dow has traded significantly below them. We will be in a better position to determine the next course of action after the markets have started to rally.
To summarize
Bullish factors
Both Dow utilities and transports have not broken below their Jan 08 lows
Utilities are trending strongly above their main up trend line
Even though the transports pulled back they were able to hold above the first break out point (Oct 2006)
Multiple Down trend lines in the Dow and thus some sort of rally should begin shortly
The Dow is holding above its first break out point in the 2 year chart
Negatives
Dow broke too fast and too easily below its Jan 08 lows and has traded significantly below them
Smart money indicator
Thankfully this indicator has been holding up well and is no where next to its Jan lows; if it continues to behave in this manner it might actually go on to issue a full fledged buy signal. The last signal was a tentative buy signal as it was 99% into the buy zone but did not make it fully into the 100% buy zone. If a full fledged signal is issued it has the potential to invalidate almost all the negative factors we have listed; we say almost because we will have to investigate what pattern the markets are putting out when and if it flashes a full fledged buy. However it is a relief to see that it has not reacted to the correction in the same manner the Dow and the NASDAQ have.
Now let's examine that potentially explosive pattern; this pattern is very interesting for in an indirect manner it substantiates almost everything we stated above.

The above chart stretches from March 2000 to Oct 04. The pattern here is eerily similar to the pattern the Dow is currently putting out in 2008; the only difference is the time frame.
After putting in what appeared to be a double bottom (points 1 to 2) the Dow traded lower to point 3 in April 2001? At this point in time it looked like a long term bottom was finally in place; several positive divergence signals were flashed and our smart money indicator was very close to the buy zone (almost 96% into the buy zone). The Dow did go on to mount what appeared to be a very strong rally which took it from 9200 all the way to 11200 in a matter of months. However the rally broke down, the old lows failed to hold and the Dow went on to put in yet another low (point 4). Once again our smart money indicator refused to flash a buy signal even though it was pretty close to the buy zone (almost 93% into the buy one; a full signal is flashed only when it is 100% and a tentative buy signal is flashed when it is 98-99% in the buy zone). The markets however were extremely oversold and so they mounted a rather impressive rally that added on roughly 2500 points to the Dow before it came to an end, taking the Dow from roughly the 8000 mark to the 10500 mark.
This rally also failed and the Dow went on to put in yet another new low (point 5); several strong positive divergence signals were flashed and our smart money indicator was in the neutral zone. (Perhaps this was a clue that a bottom was still not yet in). Once again after mounting a brief rally the Dow went on to put in yet another low (point 6); this time round our smart money indictor flashed a strong buy together with several of our other indictors and several very strong positive divergence signals were also flashed. It was around this time we went on to flash a strong buy on the market. The rally that followed was very strong indeed taking the Dow from below 7500 all the way to the 10500 plus mark and then the Dow started to trend sideways.

If one looks at the current chart which roughly spans 18 months one can immediately see that they are very strong similarities between the two. First of all we have to say this; nowadays what used years can now occur in as little as a few months and what used to take months now takes places in weeks and so on. Thus a pattern that took 3-4 years to complete can now complete itself in less than one year.
Notice the points 1 to 2 corresponds very well with the points 1 to 2 on the 1st chart. On the same token the Dow went on to put in a new low (point 3) after breaking through what appeared to be strong double bottom formation; this is exactly what took place in the 1st chart. The only difference is the speed of the reaction; the second time round everything appears to be taking place 2 times faster than it did in the first chart.
Up to point 3 the pattern is almost identical; after 3 it changes a bit. In the 1st chart the Dow goes on to put in another low (point 4) while here the Dow actually goes on to put in what looks like yet another double bottom formation (3 to 4 ).
Just like the first chart point 4 did not hold and the Dow has now traded to a new point (point 5) which is yet another new low. So far the patterns are pretty much the same. Now the question we have to ask ourselves is this; will the pattern end here or will the Dow follow the pattern in chart 1 completely and go on to generate point 6 which will end up being yet another new low? Before trading to point 6 in Chart 1 the Dow actually rallied 1500 points from roughly 7500 to roughly 9000 (July 02 to Sept 02) which is a gain of 20% in a matter of months. If the Dow had to do the same thing now it would translate into a rally of roughly 2200 points and would take the Dow to the 13500 mark or so.
This rally subsequently failed and the Dow went on to put in a final new low which in reality was only roughly 300 points lower than the previous low (difference between point 5 and point 6 on chart 1). Hardly any time elapsed between this new low and the new thunderous rally that followed; one that drove the Dow to gain over 3400 points in a matter of 14 months (Oct 02 to Jan 04); that's a whopping gain of over 47%.
Other than for a small pause in the pattern from 3 to 4 the patterns are shockingly similar and thus there is a decent chance we could end up having a point 6 on this chart too. A strong buy signal by our smart money indicator could invalidate the need for point 6. However should this not happen then we have to ask this question; what would point 6 be?

If the price point 11220 is taken out on a weekly basis; it appears that point 6 will fall roughly In the 10650 to 10800 ranges. If the Dow is to repeat this pattern then it means that it should mount a rather strong rally relatively soon as the markets are extremely oversold right now. We have no positive divergence signals right now but there is one big difference our smart money indicator flashed a tentative buy signal at point 4 and right now its holding up very well even though we are at point 5 which is a new low. Thus if it is to repeat the same pattern and point 5 is indeed the new low we should start preparing ourselves for a very strong summer rally. Now according to this pattern this rally will fail and take the Dow to yet another low but before it does it could yield very lovely gains. It is possible that there could be some divergence or that this time round the pattern could change a bit. Here are two possible scenarios
Point 6 could be avoided if our smart money indicator were to flash a very strong new buy signal
Or
Before mounting a very strong rally we actually trade to a new low and create point 6 and then mount a very strong rally. Obviously we would be in favour of the first option but whatever the outcome we are going to be studying the ensuing rally very closely to see whether we should use it as means to close our positions in anticipation of the next strong downward move. A strong buy by the smart money indicator means that the likelihood of trading to point 6 now would be reduced by at least 50% and if several positive divergence signals were also generated at the same time it would mean that there would be virtually no chance of the Dow trading to a new low before it mounted a very strong rally.
Finally we have some negative factors that we need to look at.
The bad news is that the Dow is trading significantly below its Jan 08 lows; last week we stated that it had to trade back above these levels in 6 days unless the patterns on the Dow transports or utilities indicated otherwise. Well the bad news is that the patterns on both the utilities and the transports are not strong enough to invalidate it but at the same time they are not as weak as they were when we first looked at them; they have gained strength in the last few days, thus the time line has now moved from 6 days to 12 days. It could even get stronger next week and the time line could go to neutral, meaning that we would not have to trade above a certain level before a specified time frame.
Other bad news is that despite this massive sell off the put call ratio is not spiking up significantly, neither is the VIX and the number of traders shorting shares in odd lots has not jumped up significantly either.
The good news is that despite this massive sell off our smart money indicator has not reacted in a negative way and is trading well above its Jan 08 lows; it is also very close to actually issuing a full fledged buy signal; the last signal was a tentative buy because it got to within 99% of entering the buy zone but did not quite make it into the 100% mark. The markets are also extremely oversold and as such are just begging for a reason to rally.
One other negative factor that is impossible to price in is the possibility of an attack on Iran. A war with Iran will send the price of oil to the moon and it will have far reaching implications on the entire world's economy and on all the financial markets.
Conclusion
The pattern that the Dow put in from 2001 to 2004 bears an uncanny resemblance to the current pattern and we feel that there is a very good chance that based on this pattern we could witness a rather strong summer rally. Once this rally matures we will have to determine whether we should sell into this rally and close almost all our positions except for uranium's or whether we should continue to hold our positions; if the Dow follows its old pattern the pull back could be very hard indeed. Other than a war breaking out with Iran we feel that the markets are poised to rally as they are extremely oversold. If this rally is on the same scale as that on chart 1 it could drive the Dow well past 13500 before coming to an end.
So far we experienced 7 selling climaxes in just a matter of weeks; this represents a rather large number of selling climaxes in a rather short period of time and thus at the very least some sort of relief rally should follow. A selling climax is when the down volume accounts for 90% or more of the total volume.
New Comments (July 25th, 2008)
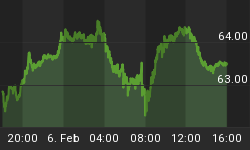
Since this article was first written the Dow went on to trade below the 11000 mark and put in an intra day low of 10872 before stabilising. Interestingly the transports broke below the 4600 mark also. The day this occurred volume surged past the 7.4 billion mark (a new record) and we would have to term this a selling frenzy as everything was dumped; the baby was thrown out with the bath water. Selling frenzies typically occur around important market turning points; based on the ensuing rally it appears that at least for now some sort of bottom is in place. On the same that that this occurred the VIX spiked past the 30 mark for the first time in months; this has to be construed as another positive.
Oil has also pulled back rather strongly in just a matter of days (roughly 24 dollars in less than two weeks) and the markets have responded to this in a very bullish way. From its low on July 15th to its recent high on the 23rd of July it rallied roughly 850 points before pulling back. Now we have to sit back and see if the pattern we spoke of above is going to be repeated or violated.
"Leave this hypocritical prating about the masses. Masses are rude, lame, unmade, pernicious in their demands and influence, and need not to be flattered, but to be schooled. I wish not to concede anything to them, but to tame, drill, divide, and break them up, and draw individuals out of them." ~ Ralph Waldo Emerson, 1803-1882, American Poet, Essayist
Major portions of this article were extracted from the July Market update.


