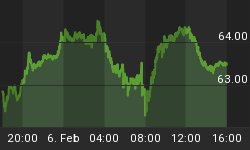
This Friday, it will be 6 full weeks that the Institutional Index has stayed within its trading range ... will it make it that long?
It was exactly one week ago when we showed you the 60 minute Point & Figure chart for the Institutional "core holdings" index. Last week's chart is posted first, followed by this week's chart.
As seen below (for last week), the Institutional Index was having a prolonged and difficult time testing the resistance of its upper trading range. At that time, it had a negative bias relative to the S&P 500's Point & Figure chart.
The negative Institutional bias won out the same day we posted it (last Wednesday), with the market moving down. See the next chart ...

Here we are one week later ...
At the close yesterday, the Institutional Index was facing the OPPOSITE testing problem.
1. During the past week, the index failed at its upper range's resistance,
2. Dropped all the way down to the range's lower support, and ...
3. Now is doing the same hesitation dance it did last week. It has now spent two days trying to hold this important support level.
A 6 week trading range: Note the red boxed in area depicting the trading range. The Institutional Index has been in a trading range since December 5th. The trading range has had 3 upside resistance/tests, and is now going through its 3rd. support test. A lot is at stake now, because the longer the time period of a trading range, the more important and consequential is its breakout.
Today will be a spirited test for the Institutional Index. At the open it will likely drop below the trading range's support. What happens next, and the rest of the day is what will matter ... as well as how it finally closes at 4 PM.
A lot is at stake today ... if the Institutional index fails to the downside, then it will move lower and retest the previous lows. However, if it can hold the support and move up, Obama will have the positive prospect of enjoying his inaugural next week ... with the chance of an upside rally if he can make some quick and positive economic moves.


