


The technical outlook on the silver market does not look all that strong when looking from a distance. I like to keep eye on the longer term trend lines for possible support and resistance levels which are easily missed if you only follow the daily charts.
Silver had an incredibly positive up move since mid of april. After establishing a low around $11.60 over 6 weeks ago it´s up more than 31% as I write this. Gold only went up around 11.5% during the same time.
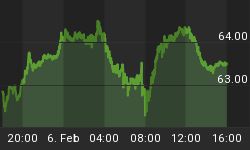
The Gold/Silver Ratio is now close to 63. Before the credit contraction last summer we normally saw the ratio moving between 44 and 60.

Looking at the charts we can see that silver is running into heavy resistance around $15-16 level. The upper Bollinger Band is currently at 15.04US$ and is a warning sign that the rally might soon be finished. As well silver is approaching the 61.8% recovery retracement of the complete downmove since last summer at $15.20-15.30. RSI is not yet in extremly oversold territory but close to. The flat 200MA is more than $3.00 away, while the disctance to the 20MA as the next possible support exactly $2 away.
On top seasonality is another factor that makes me favoring the downside right now. Sell in May has always been a wise recommendation during this ongoing longterm bullmarket in precious metals.

And finally Silver is an industrial metal. Any sell off in the broadmarkets should trigger a sell off in silver too.
To summarize, my analysis clearly points out that log positions should be tightening exit points which will allow us to lock in maximum profit from thsi current rally. If you want to short this market you should use wide stopps (e.g. above $16.01) since silver is very volatile.
You can always reenter your long position later this summer when we get a new batch of buy signals for the precious metals market which will most likely be after the typical weakness in july and august.
If you would like to receive my Free Weekly Trading Reports or Trading Signals please visit my website at: www.GoldAndOilGuy.com.


