


I hope everyone had a great weekend and is now ready for another week of trading. I have put together a few simple charts to show you what we could see with prices in the near term. While I do not predict future price movements (because it is impossible to always be correct), I do like to know what could happen and be ready to take action when something significant occurs.
The five charts below quickly summarize what I am seeing in the market currently.
Gold Stocks - HUI Monthly Chart
Gold stocks have been performing very well this year. As you can see from the chart stocks are getting squeezed into the apex, which generally creates explosive moves. We could be months away according to this chart so don't get trigger happy just yet.
A breakout to the upside will most likely trigger a very large rally. But if prices break down then I expect to see gold stocks pull back to new yearly low.

GLD Gold ETF - Gold Bullion Prices - Daily Chart
Gold has been trying to move higher the past 4 weeks and is having a tough time. With any luck gold will bounce higher Tuesday or Wednesday starting a new rally higher. If prices do not hold, up I figure we will see a sharp price drop which could go all the way back down to the $800 level within a couple months. I am currently long gold and will continue to hold it until I see a technical breakdown on the chart.

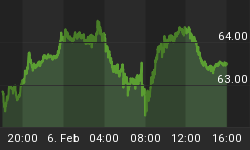
SLV Silver ETF - Silver Bullion Prices - Daily Chart
Silver is in the same situation as gol. It's pointing to higher prices but a breakdown will most likely trigger a sharp sell off. I currently own silver and will be looking to exit below the $14.00 level.

UNG Natural Gas fund - Natural Gas Prices - Daily Chart
Nat Gas looks to be breaking down once again on rising volume. We could see another waterfall type drop this week.

USO Crude Oil Fund - Crude Oil Prices - Daily Chart
Crude oil had a big pullback Friday which could make for a great short term intraday play on Monday. Sharp price drops like this will generally have bargain hunters (buyers) step in the following day to push the price higher. Also I pointed out that oil is trading at 4 different support levels. This could give prices an intraday pop or possibly start a new leg higher in the coming days.
I continue to wait for a low risk setup in oil, which is possible that we get a setup this week. Only time will tell but I will keep you posted.

Technical Traders Conclusion:
Gold stocks, gold bullion and silver are trading at support levels. The overall trend is up so there is more of a chance that we will see a bounce from here. But the market always throws in a curve ball so be prepared for locking in gains or cutting losses quickly if we see prices slide lower.
Natural Gas continues to have selling pressure and looks to be having a technical breakdown as of last Friday. This could be a nice play for those aggressive traders who want to take advantage of a 1-3 day breakdown in price.
Light Crude Oil is in a similar situation as gold and silver. Currently trading at support and could go either way, but the odds are in favor for a bounce.
I will update again on Wednesday night, if you would like to receive these quick technical trading reports to your inbox Free please visit my website: www.GoldAndOilGuy.com.


