


Excerpted from NFTRH68 dated 1/17/10:
Let's not get hung up on doing the stock market today. Friday was Op/Ex, the market took a bit of a tumble and the construct generally remains as it has been; high risk and extended. Technicals remain the same. Full Denial '10 chugs on until it doesn't.
Let's do get hung up on liquidity however, since this is FrankenMarket's primary fundamental underpinning or as the graphs show, increasingly lack of underpinning. M2 has leveled off in alignment with our theme that it is now time for the economy to prove itself on its own merits (or lack of same). The panic of 2008 into 2009 has been followed by [the predictable 'recovery'] we now enjoy. Why, they have even terminated the gray area on the graph. Recession over I guess.

MZM is actually declining slightly. These graphs mesh with the idea that a deflationary event is still in play. Ironically (and sadly), in the age of inflate or die, policy makers need a disaster from which to come to the rescue.

The setup argues that the long bond will turn up and negate the Head & Shoulders, which it is posturing to do. If this happens, the 'inflation trade' is going to be halted in its tracks.

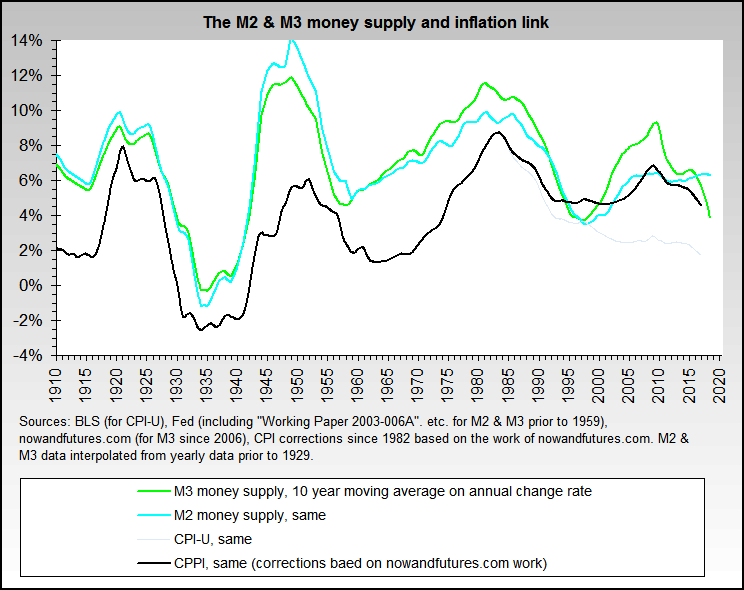
Meanwhile, Nowandfutures.com has a nice recreation of the M3 money supply data, which most readers will know was discontinued as irrelevant by the US government. Here is what Nowandfutures.com has to say about its M3 calculation:
"We did some sleuthing and data extraction and put M3 back together from various weekly Federal Reserve reports that are still available.
- The formula we're using has five 9s correlation to the original data back to 1980.
- There is only one missing element that is apparently no longer available (Eurodollars) and an adjustment has been applied to generate it. Its only about 3% of total M3 so should not have a material effect on the total.
Here is our article on M3b, which details our work and notes the sources for the data. Note that as of Nov. 10, 2006 the Eurodollar estimation formula has changed - see the article for details.
John Williams' monthly reconstruction of M3 is here. Ours tends to be more volatile and averages slightly higher than his, partly because it's weekly and partly because of our minor differences in calculating the Eurodollar component of M3 and repos.
Finally and to put M3 into proper perspective with inflation (as measured by CPI without lies), the M3 and M2 strong inflation link is virtually unquestionable. The longer term inflation picture is clear, although M2 shows a pause and likely temporary disinflation as of 2008 [emphasis mine --GT]. Certain bloggers are incorrect and have continually avoided these facts and the linked chart."


