


In many respects the current market environment can be broken down into a very simple construct: to risk or not to risk. To start this week, the risk trade is back on. Risk assets, such as stocks and commodities, are moving higher; safe haven assets, such as bonds and the Dollar, are moving lower. Last week, the risk trade was off. Safe haven assets outperformed as the risky assets went into a swoon.
From this perspective, the markets have yet to "figure out" if risk taking is warranted or not. Yes, equities have pulled back a bit and are now in bounce mode, but Treasury bonds are trading in a range, and the resolution of this trading range is likely to hold the key to the equity markets. Higher bond prices means that the risk trade is off; lower bond prices means that the risk trade is back on.
Let's look at a graphic example of what I am talking about. Figure 1 is a weekly chart of the i-Shares Lehman 20+ Year Treasury Bond Fund (symbol: TLT). Key pivot points are designated by the black dots within the yellow dots. What are key pivot points? Key pivot points are special pivot points as they are a pivot point low occurring at a time when investor sentiment towards an asset is bearish. Typically, these price levels are areas of buying or selling that result in either support or resistance.
Figure 1. TLT/ weekly
In a very basic sense, a weekly close above 93.94 is very bullish for Treasury bonds, and one should expect risk assets to be under pressure. A weekly close below 89.91 is bearish for bonds (i.e.,higher yields), and the risk trade is back on again.
From this perspective, the price action is constructive for higher bond prices. Those bullish technical tidbits include: 1) a double bottom; 2) a break of the black down sloping trend line (red down arrows) as formed by two pivot highs. A weekly close above 92.15 would be constructive for TLT, and a weekly close above 93.94 would be very bullish.
On the bearish side of the ledger, I would not get too worked up about lower bond prices until there is a break below 89.91. If this were to occur, it would likely result in much lower bond prices, and I would expect risk taking to be back in vogue.
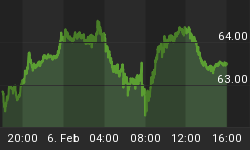
Figure 2 is the the i-Share Lehman 7-10 Year Treasury Bond Fund (symbol: IEF). This bond ETF remains stuck within its range. Bullish technical tidbits include: 1) double bottom; 2) remains above key support at 89.79. A breakout and weekly close above the black down trend line and the 91.25 would be very bullish for IEF. A weekly close below 89.79 would suggest caution and weekly close below the double bottom at 88.62 would likely lead to much lower bond prices suggesting that the risk trade is back on.
Figure 2. IEF/ weekly
In summary, long term Treasury bonds remain range bound. A break of this trading range will provide clues as to the risk appetite seen in the markets.


