


Although equities were up nicely week over week, investors are not in a mood to chase prices higher. Investor sentiment is neutral, and to me, this suggests that there is nothing very compelling regarding the current market environment.
The "Dumb Money" indicator (see figure 1) looks for extremes in the data from 4 different groups of investors who historically have been wrong on the market: 1) Investors Intelligence; 2) Market Vane; 3) American Association of Individual Investors; and 4) the put call ratio. This indicator is neutral.
Figure 1. "Dumb Money"/ weekly
Figure 2 is a weekly chart of the SP500 with the InsiderScore "entire market" value in the lower panel. From the InsiderScore weekly report we summarize: "Insider sentiment shifted from bearish to neutral as executives, directors and 10% owners at Russell 2000 companies and within the Financial and Consumer Discretionary showed a more positive outlook. It should be noted that trading volume started its seasonal decline as companies began closing trading windows ahead of the end of the quarter. Qualitatively, we were pleasantly surprised by the number of buyers, especially so close to the end of the quarter; and, we were also surprised by the quality of buying (Actionable Buy research briefs outnumbered Actionable Sell research briefs for the first time in months). Volume will continue to decrease over the next several weeks and will thin significantly once the calendar turns to April and Q2'11 begins."
Figure 2. InsiderScore "Entire Market" Value/ weekly
Figure 3 is a weekly chart of the SP500. The indicator in the lower panel measures all the assets in the Rydex bullish oriented equity funds divided by the sum of assets in the bullish oriented equity funds plus the assets in the bearish oriented equity funds. When the indicator is green, the value is low and there is fear in the market; this is where market bottoms are forged. When the indicator is red, there is complacency in the market. There are too many bulls and this is when market advances stall.
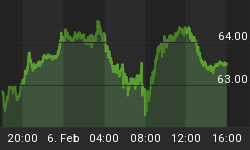
Currently, the value of the indicator is 63.86%. Values less than 50% are associated with market bottoms. Values greater than 58% are associated with market tops.
Figure 3. Rydex Total Bull v. Total Bear/ weekly
Improve your market timing with Premium Content from TheTechnicalTake.
The Premium Content service is the best $104 you will ever spend on market research. The daily report is meant to keep you on the right side of the market and improve your market timing. That's 40 cents a day!
Even in this confusing market environment, The Premium Content service has been useful in identifying trading opportunities. The indicators have functioned as expected!!!
To learn more about this service click here: Premium Content


