


Well, from an investment perspective it really all comes down to this. With the stock market dropping, oil plunging, and the economy softening, are we going to get a 'boing' sound when the ball bounces off the pavement, or are we going to hear 'splat' as the ball hits the pavement and breaks open?
The current signs are not promising.
Initial Claims was the first disappointment of the day, rising to 429k with an upward revision to 420k. The expectations were for 415k, so with revisions the miss was about 20k. That's fairly large for this time of year, and while the fact that the chart of Claims looks suddenly less promising (see Chart) is mostly an illusion - as one wag observed, 'where did the slow downtrend go?' - many economists are influenced by just such pictures and will begin to change their assumptions about the trajectory of the economy from 'boing' to 'splat.'

Initial Claims - doing nothing good.
Other things are splatting as well. Oil prices, for one; the International Energy Agency (IEA) announced today a determination to release 60 million barrels from its stockpile and the U.S. said it would also flush some 30 million barrels from the Strategic Petroleum Reserve. This happens as oil was already trading closer to the lows of the year than to the highs, well under $100/bbl. The IEA has only released oil two other times: during the first Gulf War in 1991 and following the destruction of Gulf of Mexico oil rigs by Katrina in 2005. The current release is supposedly triggered by the lack of Libyan oil, but since market prices weren't suggesting any scarcity from that reason the reason rings hollow. Interestingly, after the IEA announcement oil futures only fell another $1-2 so it seems pretty plain that some players already had the information. NYMEX Crude ended the day -3.9% at $91.85, off the day's low.
Nevertheless, the drop in energy quotes along with the drop in precious metals occasioned by the dollar's strength today caused major commodity indices to gap through important support points. The chart below, of the DJ-UBS commodity index, is one example. Chartists will have a field day with that picture, and it's not pleasing to those of us (myself included) who are overweight commodity indices in preference to stocks. It is looking very 'splatty', although I continue to believe that the long-tail potential gains if central banks start to monetize again are worth the risk of setbacks based on nominal supply/nominal demand analysis. In an inflationary environment, it won't matter whether stockpiles of oil are being sold; the commodity will exchange for a higher number of more-plentiful dollars.

Technically speaking, commodity index charts look ugly.
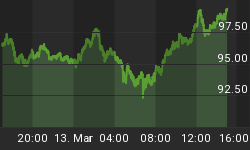
There was one bouncy market today, although until 3:00ET stocks didn't look bouncy at all as the S&P was flirting with last week's lows (and the lows for the year not far beyond that). At that hour, however, a pair of Bloomberg headlines suggested that there may be a deal between Greece and the IMF and Europe on an austerity deal. Now, you may recall that the Greek Prime Minister just survived a confidence vote based on the old austerity plan; external parties then decided that the plan in question wasn't quite austere enough. But since all of the parties who voted their confidence earlier this week were not party to the 'new deal,' it isn't clear why that's particularly good news. Indeed, one would expect the folks who just voted their support for the PM based on one deal would be pretty miffed and if anything perhaps less likely to vote for a new deal. But the news was enough to scare gutless shorts to cover. Really, the only stock I want to own right now is one for a company that makes underwear, because it seems investors are soiling themselves exceptionally easily these days.
I will say that having commodities go down and equities tread water strikes me as an unlikely combination in time frame other than the short term. If Greece is saved then the dollar will not likely continue to rally, and equities have the added handicap of being expensively valued.
And speaking of the dollar, while it rallied today I wonder how long that is likely to last if the talks about raising the U.S. debt ceiling stay stalled for very long. Today, a couple of Republicans abandoned the "Biden talks" about debt reduction (if you want to inspire bipartisan sacrifice, calling them the "Biden talks" is probably not a good start) and supposedly President Obama is going to add his leadership to help "break the impasse." Oh, great. See what I mean about the demand for underwear?
The TIPS auction went very well today, clearing at 1.744% with a 3.02 bid:cover ratio and 26% going to direct bidders. What that means is that there is a great demand for long-dated inflation protection, which given the yields we're talking about is pretty discouraging about the perception of the long-term growth outlook (since real yields and real growth are closely related).
The real interest rate curve crashed flatter, with 2-year real yields up about 7bps and 30-year real yields down 12bps to 1.70% by the end of the day. A 19bp flattening from 2s to 30s is a pretty impressive move. Since the nominal yield curve rallied mostly in parallel today, the implication is that 2-year inflation dropped about 10bps and 30-year inflation rose about 8bps. This suggests that market views are evolving to expect a sharper escalation of inflation coming a bit further in the future, and reaching a higher level. The chart below (Source: Enduring Investments) illustrates the spot inflation swap curve and the curve of 1-year forward inflation rates (without convexity adjustment) it implies. You can see that the market is now pricing in a period of time with inflation significantly above 3%. The 5y, 5y forward, in fact, is at 3.12%, higher than it has been in several months.

Inflation curves derived from US CPI swap rates.
It is hard to imagine that the fact the most powerful central banker in the world admitted he's "clueless" in the words of one blogger had nothing to do with the marking-down of long-term growth prospects, as reflected in long-term real yields.
So, overall, decidedly splatty. Which means, sadly, that the race may not be to the bold but to those with the best underwear.


