


It is the beginning of a new month, so let's review our models on equities, bonds, gold, and crude oil -- where are they and what is going on.

The SP500 ended the month below the 10 month moving average, and this is a sell signal for a widely followed strategy that utilizes the 10 month moving to generate buy and sell signals. When you couple this model with two other SP500 models that I have developed, essentially there is little reason to be in the market until one of these models generates a buy signal. Or to put it differently, any reason to be buying at this point would have to be considered a counter trend trade. (More on this below.) For now, the important point to make is that if you did nothing -- sat on your hands until one of these models generated a buy signal -- the most in gains that you would likely be giving up is about 5%. With about a 1 in 4 chance of seeing a real significant bear market with losses greater than 25% (from this point going forward), sitting on your hands or playing small may be appropriate for the risk adverse investor.
As you know, investor sentiment has been extremely bearish, and I regard this as a bullish signal. As I believe we are already in a bear market, this current trade has to be viewed as a counter trend trade until proven otherwise. Based upon the models above and other factors, it is my expectation that profits are likely to be taken when prices get closer to their 40 week moving averages or when investor sentiment turns overly bullish again. I suspect it will be the former.

My Treasury bond model has been positive since March 11, 2011. A friend of mine asked: "Why I am investing in Treasury bonds?" Six reasons. One, the model says so. Two, bonds are the great diversifier and highly uncorrelated to other assets. Three, since March, the i-Shares Lehman 20 year Bond Fund (symbol: TLT) is up about 20%. Four, the Fed is targeting bonds. Five, the economy is sucking wind and this is deflationary not inflationary. Six, how many times in the past year have you heard that Treasury bonds are the worst investment ever? Hey, this cannot go on forever especially since former bond bear, Bill Gross of PIMCO, has recently thrown in the towel (See article here). For now the model is positive and bonds are somewhat oversold.

Gold remains constructive. The fundamentals are very strong as bond yields continue to fall and as short term interest rates remain below inflation measures. But like all things, trends ebb and flow, and gold appears to be in a consolidation phase -- this is my interpretation of the recent price action. Gold should do well if there is money printing (QE3), and if there isn't and equities fall (i.e., safe haven). A weak economy will keep yields low and gold high.

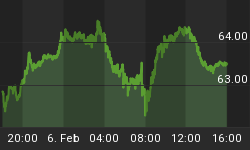
My crude oil model is bearish. A timely sell signal was generated last month. Crude oil subsequently fell nearly 20%, and as the month has closed, it has recovered about half of its losses.


