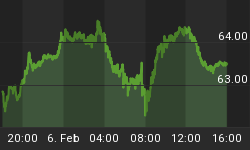
The heartwarming message delivered by today's ISM figures was all is not lost. It could be worse. Against expectations for a 48.5 print, the rumor started swirling about ten minutes before the number that the actual figure would be around 43. When the true data showed up at 50.6, there was a sigh of relief and a swift pop in the stock market. Bonds took a beating at the same time. The message sent by ISM is this: manufacturing is not in a recession (to be sure, 48.5 wouldn't have indicated a recession either, because negative growth is associated with a number a few points below 50, but the symbolism is important).
We could be cynical and sneer "...yet" at the end of that sentence, but while the trajectory of manufacturing is something less than awesome it is something more than ominous. Maybe (See Chart).

Nothing to panic about yet, but also nothing to celebrate here.
Still, if the best we can say about manufacturing is that it isn't in outright recession, that's certainly damning with faint praise. The fine economists at Goldman Sachs (and I don't mean that ironically; while they've lost their best guy they still put out terrific economic research) put out a piece today, pointing out that the "soft" data - such as consumer confidence surveys - has been truly awful while the "hard" data involving actual measurement of economic activity - employment and production indicators for example - haven't been too bad at all. Anyone can notice that, but Goldman took it one step further and asked "Well, in circumstances like this should we put more weight on the more-timely (but 'soft') indicators or the less-timely (but 'hard') indicators?" Typically for Goldman, they produced a bunch of regressions but the simple conclusion was that:
The basic message from the estimates is simple: the timely soft data should get a high weight, regardless if we are projecting the total CAI -- which already includes the survey-based indicators -- or measures of hard data. Although the strength in lagged hard data is moderately encouraging, these equations suggest that the downturn in the soft data is quite important for the outlook, and that we should expect somewhat slower growth over the next few months.
They observed that there are some reasons that this might not be as true this time, for example if the confidence bust was mostly due to the debt ceiling debate, but overall they suggest focusing on the more-timely data.
Which brings us to tomorrow's Nonfarm Payrolls data. The consensus for jobs is +68k (from +117k last month). That estimate has been falling a bit recently, despite the gradual improvement in Initial Claims (although it's still 409k). One excuse will be the Verizon effect (45,000 workers were out on strike during part of August), but look for the BLS to estimate that impact if it is significant in the data. I think that the estimate is reasonable, and plus or minus 20k from there shouldn't matter. Alarm bells will sound, however, with a sub-zero print...whatever the explanation.
Can the stock market survive a negative print, or a rise in the Unemployment Rate? The consensus estimate for the rate calls for it to be unchanged at 9.1%, but the large jump in the "Jobs Hard to Get" reading in the Consumer Confidence report suggests that a rise is likely. Do I feel bad going against the grain and 'forecasting' (as much as I ever do play that game) a 9.2%? Not really. Look at the chart below, from Bloomberg, and see if you can divine the economist heuristic for estimating the Payrolls number.

You too can be a Wall Street economist.
As near as I can tell, the median estimate is unchanged, every month this year. The green line looks like the white line, shifted one period!
If the Unemployment Rate does not rise, I will next look at the Participation Rate and see if the reason it didn't rise is because people have been dropping out of the survey. And I'll look at the "Not In Labor Force, Want A Job Now" statistic. While the Unemployment Rate has been behaving okay over the last few months, those latter two statistics haven't been very good and have certainly contributed to the sense of malaise.
We have a three-day weekend coming up in the U.S., and I suspect that investors will prefer to head home long the bond market rather than short it despite levels that appear very rich. TIPS and Treasuries both rallied convincingly today, and the inflation curve flattened (that is, near-term inflation swaps rose more than long-term inflation swaps). The 1-year inflation swap is almost back to fair value now, in a blistering move as it has tried earnestly to keep up with gasoline. October RBOB (that's gasoline) is almost back to the levels seen in July, right around $3/gallon. The front contract in July was higher, closer to $3.20, but some of that is a normal seasonal effect as gasoline prices tend to be higher in the summer. Price at the pump is only about $0.08 below the July level although well off the May highs near four bucks. Keep an eye on gasoline prices. Consumer confidence is already bad; if discretionary expenditures take a hit because gasoline prices eat up what are already tight budgets for many Americans, there might be a march on Washington! I'm only half kidding.
Have a nice Labor Day weekend.


