• 314 days Will The ECB Continue To Hike Rates?
  • 315 days Forbes: Aramco Remains Largest Company In The Middle East
  • 316 days Caltech Scientists Succesfully Beam Back Solar Power From Space
  • 716 days Could Crypto Overtake Traditional Investment?
  • 721 days Americans Still Quitting Jobs At Record Pace
  • 723 days FinTech Startups Tapping VC Money for ‘Immigrant Banking’
  • 726 days Is The Dollar Too Strong?
  • 726 days Big Tech Disappoints Investors on Earnings Calls
  • 727 days Fear And Celebration On Twitter as Musk Takes The Reins
  • 729 days China Is Quietly Trying To Distance Itself From Russia
  • 729 days Tech and Internet Giants’ Earnings In Focus After Netflix’s Stinker
  • 733 days Crypto Investors Won Big In 2021
  • 733 days The ‘Metaverse’ Economy Could be Worth $13 Trillion By 2030
  • 734 days Food Prices Are Skyrocketing As Putin’s War Persists
  • 736 days Pentagon Resignations Illustrate Our ‘Commercial’ Defense Dilemma
  • 737 days US Banks Shrug off Nearly $15 Billion In Russian Write-Offs
  • 740 days Cannabis Stocks in Holding Pattern Despite Positive Momentum
  • 741 days Is Musk A Bastion Of Free Speech Or Will His Absolutist Stance Backfire?
  • 741 days Two ETFs That Could Hedge Against Extreme Market Volatility
  • 743 days Are NFTs About To Take Over Gaming?
  1. Home
  2. Markets
  3. Other

So Many Positive Divergences

First of all, it is important to notice we had once again a reversal day (hammer) in the United States yesterday. See our Sigma Whole market index (aggregate of 16 US indexes) below.

Any move above 1410 on our Sigma Whole Market Index (horizontal blue line) should be consider as an exit signal for short positions.

Sigma Whole Market Index

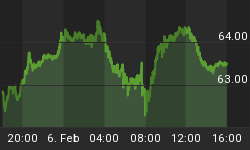
At the same time, the forex brook a one month downtrend, and it is now testing the 23.6% retracement level. As we had a perfect correlation between forex and equity markets in recent weeks, we must keep an eye on this market.

It is also important to notice we have an important divergence between price and RSI: downtrend in price BUT uptrend in RSI (blue line and purple line on RSI).

RSI

Looking at our Sigma Trend Index (STI), we can also notice a positive divergence between our Sigma Market Index (blue line) and the STI (red line). It is a warning signal for the bear trend:

Sigma Trading Oscillator

Looking at our Breadth Index, we can also notice a positive divergence: higher low on the breadth while lower low in price:

Market Breadth

Looking at the Sigma Short Term Sentiment, we can also notice this positive divergence:

Sigma Short Term Sentiment

Conclusion:

The downtrend is weakening and looks in danger. (a short term bottom could already be in place)

We move our take profit on our short position from 1302 to 1292 (stop buy order).

Current position: 1/2 short @ 1334.07

Have a nice day,


Back to homepage

Leave a comment

Leave a comment