


While we appreciate the instant gratification, the recent news out of Cyprus on Saturday was nonetheless surprising in light of our silver:gold/SPX performance model that fulfilled the criteria of a sell signal at the end of last week (see Here). Not making the comparison that some in the media have extended this weekend, but we couldn't help but notice the last occasion the spread flashed concern was directly before the Lehman Brothers bankruptcy in September 2008.

Despite the newborn fracture in the equity markets, the now maturing and cascading trend in the euro is starting to make greater headline and fundamental sense - in light of the explosive correlation conditions highlighted in the ECB Hubris Meter chart over the past two months.

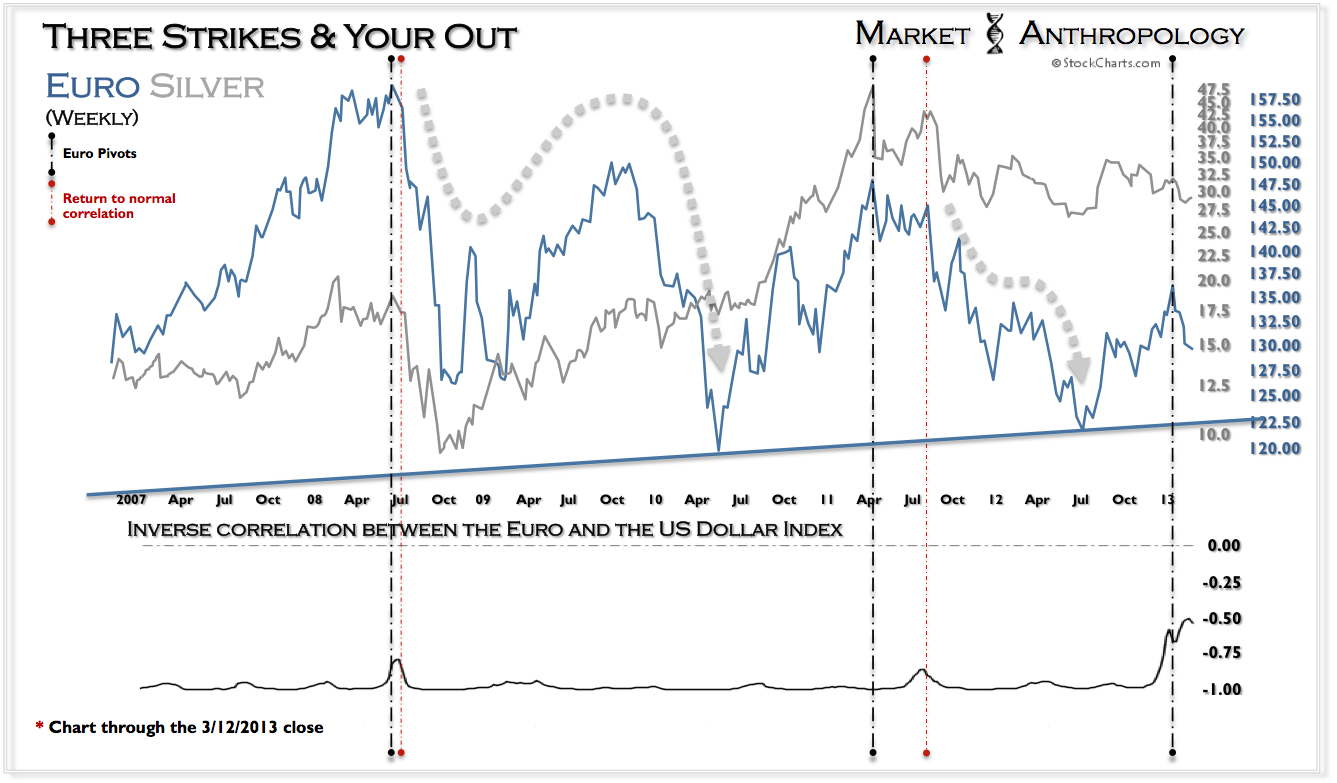
Come Monday, the euro's Mirrored Pivot track should fulfill another downside proportion on its way to likely an initial test of long-term support ~122.

Although we recognize the strength of the US recovery to-date, we feel the primary driver of the US dollar is considerably less motivated by the vintage of economic prosperity that drove its last secular turn. The long and short of things - we feel the juxtaposition this time around the block looks weak.

Downstream, the asset relationships that are heavily impacted by dollar strength / euro weakness continue to appear vulnerable to further declines.


We will be closely watching the Shanghai Composite Index to see if it continues to roll-over - or rekindle the trend higher as the breakout leg of the 1982 SPX comparative did. Should the uptrend reestablish itself, we would consider it a major positive proxy for the balance of growth X-Europe and primarily driven and smoothed by US demand and Chinese stimulus. Color us skeptical to say the least.

* All stock chart data originally sourced and courtesy of www.stockcharts.com and the Federal Reserve Economic Database
* Subsequent overlays and renderings completed by Market Anthropology
* A labeling error on the previous Silver:Gold/SPX Performance charts was corrected this week from: 03/17/00 to 03/24/00. The data was always accurately derived from the weekly high on 03/24/00


