


On October 25, 1929, one of the great Dow Theorists, William P. Hamilton penned what was to become the obituary for the great 1920s bull market. The Dow Industrials closed at an all-time high of 381.17 on September 3, 1929. On the day the editorial was published on the Wall Street Journal, the Dow Industrials closed at 301.22. This was on a Friday. The markets were opened for a half session the next day, and the Dow Industrials declined slightly to 298.97 on relatively light volume. Then on Monday and Tuesday, the market crashed. By Tuesday at the close, the Dow Industrials stood only at 230.07. The great bear market of September 1929 to July 1932 has just begun. More than two and a half years later (on July 7, 1932 to be exact), the Dow Industrials bottomed at a shockingly low level of 41.81.
Part of the editorial, entitled "A Turn in the Tide," from William P. Hamilton is reproduced below:
"On the late Charles H. Dow's well known method of reading the stock market movement from the Dow-Jones averages, the twenty railroad stocks on Wednesday, October 23 confirmed a bearish indication given by the industrials two days before. Together the averages gave the signal for a bear market in stocks after a major bull market with the unprecedented duration of almost six years. It is noteworthy that Barron's and the Dow-Jones NEWS service on October 21 pointed out the significance of the industrial signal, given subsequent confirmation by the railroad average."
First of all, I want to emphasize that my writings can be in no way compared to Hamilton's writings on both the WSJ and Barron's in the early parts of the 20th century. I have great respect for the writings of all the major Dow Theorists (this being Dow, Hamilton, Rhea, Schafer, and Russell) but at the same time, I have also warned about the maturity of the both the liquidity cycle and the profit cycle in my commentaries over the last several weeks. The watershed decline last Friday on increasing volume further reaffirmed by beliefs, not to mention the ongoing ominous developments at FNM, FRE, AIG, GM, the business disappointments at SBUX, WMT, IBM, a high oil price, and the further breakdown of the Bank Index when it declined below the great support level of 95 and closed at 94.54 on Friday . Maybe I have not "earned the right" to use the title that Hamilton used in his October 25, 1929, obituary, but I believe the description inherent in such a title is very fitting to the stock market as of this very moment.
Now, for a little bit of talk about the Dow Theory in general: While I understand that the Dow Theory is actually based on a series of articles and beliefs written by Charles Dow (and subsequently modified by William P. Hamilton, Robert Rhea, E. George Schaefer, and Richard Russell) and thus can be interpreted in many different ways, it is to be said here that the true basis of the Dow Theory is based on the concept of "values" (and no, I don't believe measuring the value of stocks using the Fed's model makes logical sense over the long run). The second most important concept is the concept of the primary trend. Based on the Dow Theory and based on my many countless analyses of the liquidity cycle and the profit cycle over the last several weeks and as late as last Friday, it should now be obvious to anyone (and especially the Dow Theorists) that both the short-term and the intermediate term trend is now bearish. The Dow Theorists who try to interpret or forecast the action of the stock market strictly based on the movements of the Dow Industrials and Dow Transports have done nothing but bastardized the Dow Theory and turn it on its head. They have done nothing but a great disservice to both Charles Dow and the many investors who follow them.
Now, let's get on to our commentary, once again.
For people who believe that all I am preaching is fear-mongering and telling my readers to be "chicken littles" - well, you can stop reading right now. Otherwise, please go back to our archives and read some of our past commentaries, especially the commentaries written during August 2004 and just prior to the Presidential election. We were being bullish at the time when it wasn't popular to be bullish, even though we were approaching the late stage of the cycle at that point. I try to call it like I see it, and it is definitely not a good idea to "waffle" at this point in the game. Serious money is at stake here.
Like I mentioned in my "Special Alert" on Saturday morning sent to all our subscribers, I have been warning of a serious decline during the last several weeks. I have also mentioned that while the McClellan Oscillator (as opposed to the McClellan Summation Index - which had been at neutral levels more or less) and the bulls-bears% differential in the AAII survey had been at very oversold levels during the last few weeks, most of my other technical indicators had not been confirming - and were actually at neutral to slightly oversold levels in general. Furthermore, I mentioned that the last time that such a divergence/non-confirmation has happened was during the June to early July 2002 period - right before the July 2002 plunge.
The current message remains the same message from last week and a couple of weeks ago. Things are still looking grim and there is still no end in sight. Sure, the AAII survey is still very oversold, but this has been the theme from last week and even several weeks ago. While the bulls-bears% differential in the Investors Intelligence Survey is now also reaching the very oversold level, most of my other technical indicators are only now starting to move to the oversold level - including the institutional favorites such as XOM, AXP, JPM, SBUX, IBM, GOOG, AA, and HON which have only started to break down or are in the processing of breaking down. Please also keep in mind that cyclical stocks such as the homebuilders are still at nose-bleed levels, and there is still potentially a long way down to go. No, we are not really that oversold in the grand scheme of things.
In our "Special Alert" on Saturday morning, I discussed the NYSE ARMS Index and the fact that the one-day reading on Friday only closed at 1.67 while the 10-day moving average actually declined to a reading of 1.195. Folks, this indicator is telling us that the market is only slightly oversold! Two years ago, such a one-day plunge in the Dow Industrials on Friday would have given us a one-day ARMS reading of over 3.0. Moreover, the ARMS Index has not given us a reading of over 2.0 since January 19th. Let's now take a look at the NYSE ARMS Index (along with its 10-day and 21-day moving averages) vs. the Dow Industrials from January 2003 to the present:

Don't get me wrong - I am an optimist at heart - I would definitely like us to be in a primary bull market trend here. I have also been trying to find ways to justify a bottom here. Yes, I have found some things but they were at odds with most of my other technical indicators and analyses. In fact, the oversold readings in the AAII survey and the McClellan Oscillator (again, don't get this confused with the McClellan Summation Index) coming in the face of slightly or even neutral readings of my other important indicators suggested to me several weeks ago that we may be in for a watershed decline. The action of the stock market during the last several weeks certainly reaffirmed those beliefs. Like the above chart mentioned, the current 10-day moving average of the ARMS Index currently only sits at 1.195. Considering the ominous action of the last two weeks and considering that we are now so late in both the liquidity and the profit cycle, a one-day reading of 1.67 and a 10-day reading of 1.195 is definitely nowhere low enough for a sustainable nor a tradable bottom here. I have mentioned this numerous times before, but I would like to see a 10-day reading close to or over 1.50 before I will be willing to call a sustainable bottom.
New subscribers here may wonder: Who do I mean when I say that we are now late in the profits cycle? New and old subscribers alike should go back and read our March 31st "It is Now Late in the Cycle!" commentary, but for readers who want a quick version, following is chart of corporate profits and corporate profits as a percentage of GDP over the last 25 years - a chart which I posted in our March 31st commentary:

Please note that the 25-year average of corporate profits as a percentage of GDP stands at 7.04% - with the actual readings vacillating around the 7.04% line. I find it amazing that analysts ignore this and retail investors do not realize this, but over the long-run, total corporate profits cannot grow faster than the GDP of this country! During the fourth quarter of 2004, corporate profits as a percentage of GDP rose to 9%, a high not seen since the second quarter of 1997. The analysts who are continuing to expect 10% growth in corporate earnings (especially at this stage of the liquidity and profit cycle) while the GDP of the U.S. economy is only growing at a rate slightly north that of 3.5% just do not know what they are talking about. Historically, stock market analysts have always been over-optimistic on corporate earnings. It looks like we are now in for another treat, once again - courtesy of the Wall Street analysts.
Another area of study which the economists and analysts have been dismal in is the subject of economic forecasting. Let there be no mistake: Not only is the Dow Jones Industrial Average the bellwether of the U.S. economy, it is also a good bellwether of the world economy - given the diversity of the businesses of the thirty companies in the Dow Jones Industrial Average. The sluggishness of the DJIA over the last two months combined with the ominous action over the last couple of weeks is speaking volumes, and yet all the economists are still predicting 3.5% growth in GDP over the next twelve months. The action in Wal-Mart is predicting that the U.S. consumer is now spent. So is the action of Home Depot and Starbucks. The action of AIG, FRE, FNM, and the breakdown of the Bank Index is forecasting the loss of confidence in the financial and insurance sector. GM hitting another 40-year low on Friday is predicting further loss of the U.S. manufacturing sector. I still cannot believe that economists are naïve enough to believe that oil prices >$50 a barrel will not have a recessionary effect on the world economy. Combined with the fact that the Fed is continuing to raise ST rates (along with the rest of the world's Central Banks also cutting down on liquidity), a slowdown in the world economy is now imminent.
The Bank Credit Analyst has been doing a great job over the last few days with regards to this topic. Following is a chart from the Bank Credit Analyst showing their proprietary Global Leading Economic Indicator vs. their Global LEI Diffusion Index (which measures the proportion of the world's economies with a rising LEI) from 1990 to the present:

Please note that both the global LEI and the global LEI diffusion index has been declining since the latter part of 2003 and the early part of 2004 - around the time that the semiconductors and the airlines topped out. The history of these two leading indicators has been phenomenal. Note that these two indicators also topped out sometime in 1997, right at the top of the last corporate profits cycle. The Bank Credit Analyst also commented that out of all the world's major economies, the U.S. economy has been the most resilient. This corresponds with the view that I have had over the last few months - that at some point this year, there will be a flight to quality in the world's markets from the emerging market economies to an economy such as the American economy. China and India (its stock market has risen nearly 50% over the last 10 months) is no exception. In fact, these two economies remain the most vulnerable, as their economies rely substantially on the U.S. consumer and the prosperity of U.S. businesses going forward - at least until their own domestic markets are developed - which is still probably a decade away.
Speaking of emerging market economies, the Bank Credit Analyst also had a good discussion of them on Friday's short commentary. I will quote: "While the structural outlook for EM stocks is bullish, the cyclical backdrop is less favorable. Global economic growth is still decelerating, the Fed is steadily hiking interest rates and the premium on high-risk assets (such as EM stocks) is rising. Moreover, as the chart shows, the commodity cycle is also flashing a warning sign for EM stocks. Given that EM share prices have more than doubled since early 2003, we expect further selling pressure in light of the increasingly turbulent global backdrop. Bottom line: there are additional downside risks for EM equities." The following chart is courtesy of the Bank Credit Analyst:

Historically, the most marginal countries (whether they are a marginal "consumer" of energy or credit) - i.e. the emerging markets have led the U.S. in a general economic slowdown or in a general market downdraft. This happened during the 1949 to 1966 great bull market, as the major Western European countries (along with Japan) topped out nearly four years ahead of the U.S. stock market. This happened again during the Asian Crisis of 1997 and the Russian/Brazilian/LTCM Crises of 1998 - when the world's major emerging market economies topped out two to three years of ahead of the U.S. stock market/economy. It now looks like it's happening again. The more I look at this everyday, the more it looks like the Chinese economy will experience a recession before the Olympics in 2008. I believe this will all be obvious within the next six to nine months.
The other technical indicator that I mentioned in my "Special Alert" to my subscribers this weekend was the NYSE McClellan Summation Index (Ratio Adjusted). In that "Special Alert" I mentioned: "The latter [the NYSE McClellan Summation Index] is now at a level of negative 369.25. Is it oversold? Sure, it is oversold - just like the many times I have mentioned over the last couple of weeks. However, it is notable that the serious declines in the stock market usually just start when the McClellan Summation Index is at this level. And I am talking about looking back the stock market going back to the 1920s. This includes the 1929 crash, the various declines during the 1929 to 1932 bear market, the 1937 crash, the 1957, 1962, 1966, 1969 to 1970, 1973 to 1974 declines, the 1987 crash, the 1990 Gulf War Scare, the 1998 LTCM and Russia Crises, September 11th, and not to mention the June to July 2002 decline." You couldn't have had a more dependable indicator. Following is a three-year chart (courtesy of Decisionpoint.com) showing the NYSE Composite vs. the NYSE McClellan Oscillator (Ratio Adjusted) and the NYSE McClellan Summation Index (also Ratio Adjusted):

The last time that this happened was early March of last year. The Dow Industrials proceeded to lose 500 points within the next few weeks. However, I do not believe that this is a valid comparison since we are so late in the liquidity and the profit cycle - and the fact that we have not really had a significant correction since the cyclical bull market began in October 2002 (or March 2003 as people would like to label it). Perhaps a slightly more valid comparison would be when the McClellan Summation Index (Ratio Adjusted) hit this level in early July 2002. On July 5, 2002, the Dow Industrials closed up 325 points to 9,379.50. A few weeks later, the Dow Industrials bottomed only July 23, 2002 at a close of 7,702.34 - a plunge of 1,677.16 points in less than three weeks.
Perhaps an analysis that would be even more fitting would be a comparison between today's market and the market in the summer of 1998. In my past commentaries over the last several weeks, I have stated that the emerging markets would be the first to go in a "flight to quality" scenario - a scenario which I have often said will occur in the markets sometime this year. Such a scenario occurred in the summer of and late 1998 - culminating in the LTCM crisis which required a bailout orchestrated by the Federal Reserve and several investment banks. Following is a historical chart showing the McClellan Summation Index vs. the NYSE Composite from 1996 to 1998, courtesy of Decisionpoint.com:

As mentioned on the above chart, when the McClellan Summation Index (Ratio Adjusted) touched a similar level in late May 1998, the market made a half-hearted bottom and tried to recover - unsuccessfully. The Summation Index proceeded to test the zero line before plunging again to the current level in late July and early August. On July 31, 1998, the Dow Industrials closed at 8.883.29. When the Dow Industrials made a sustainable bottom on August 31, 1998, the Dow Industrials closed at 7,539.07 - giving the Dow Industrials a total loss of 1,344.22 points within the space of four trading weeks.
We could very well have a significant bounce coming within the next few days, but I believe such a bounce (which would take the Summation Index back to the zero line at the most) would be an opportunity to sell your positions and raise cash, not to initiate new positions. Conversely, we may not even have a bounce after all - only to see a plunge over the next few weeks with a slight bounce here and there. Furthermore, I want to emphasize this: The fact that the McClellan Summation Index (Ratio Adjusted) is currently below the zero line and "trading" at negative 369.25 tells me that something is inherently wrong with the stock market. Repeat: It is wise to raise cash at this point.
Let's now go ahead and discuss the action of the Dow Industrials vs. the Dow Transports over the last week along with our popular sentiment indicators. One of them may actually surprise you. Let's start off with our familiar chart - the daily chart of the Dow Industrials vs. the Dow Transports:

Both the Dow Industrials and the Dow Transports experienced the worst week in two years - with the former declining 373 points and the latter declining a huge 213 points for the week. But probably the more important development was that both the Dow Industrials and the Dow Transports actually penetrated their January 24th lows as early as Thursday at the close. Friday's huge watershed decline just put "the icing on the cake," so to speak. Based on the interpretation of the action of the Dow Industrials and the Dow Transports, there is definitely more room to go on the downside.
I know this commentary is now getting long-winded so I will try to conclude this quickly with a quick rundown of our (well, mine mostly) favorite sentiment indicators. Let's start off with the bulls-bears% differential in the AAII survey vs. the Dow Industrials. No surprise here: This sentiment indicator has been oversold for weeks and it just got more deeply oversold last week:

I would never trust any analyst who only bases his "analysis" on one piece of "evidence" or study to justify his beliefs. The results from the AAII survey is a case in point. If one is bullish, one can always find something (a study or a single indicator that has worked in the past) to justify his beliefs even in a bear trend. Same argument for an analyst who wants to be bearish in a bull market. If one really tries hard to find something, then one will always be able to find something that is contra to the current trend. According to some analysts, the AAII survey had been flashing "buy signals" for the last several weeks. What these analysts have ignored is that most of my technical indicators (which are all very mainstream if one wants to know) have not been confirming the oversold condition of the AAII survey. In fact, an oversold AAII reading not accompanied by similar oversold readings in other technical and sentiment indicators has nearly always been a precursor to a significant plunge in the stock market.
The Investors Intelligence Survey is now getting to the "very oversold" stage, but I would still like to see a sub-10% reading before going long in our DJIA Timing System:

We should definitely see a lower reading this upcoming week, but whether we will get a sub-10% reading I still do not know. Even if we do, a bottom is not a given - keep in mind that this reading actually got to as low as negative 14.8% during the October 2002 lows.
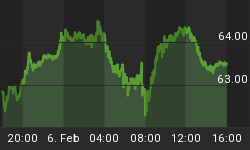
Now, the surprise is this: The Market Vane's Bullish Consensus actually INCREASED from 63% to 64% as of last week. This is very ominous, as from a contrarian standpoint, it indicates that the market definitely has some more downside to go:

Just like I have mentioned over the past several months, I would like to see a the Market Vane's Bullish Consensus hit the 50% line before going long in our DJIA Timing System. But in the more immediate timeframe, the relatively high 64% reading is definitely cause for concern especially for this week's action.
Conclusion: Our message remains the same. Hopefully, it is loud and clear. Remain in cash (or raise cash) and barring an >8% decline in the major indices in the early part of this week, please don't look to go long here. The emerging markets are now in the process of breaking down, and the upcoming earnings reports should be a disappointment given the fact that we are now so late in both the liquidity and the profits cycle. The Bank Index has finally broken the 95 support level, and the Fed has lost whatever maneuvering flexibility that they had a few years ago. The world economy is now also slowing down, and it is totally ridiculous to expect 10% growth in earnings when corporate profits as a percentage are at a historic high of 9% while GDP growth is projected to slow down. I may also be jumping the gun here but there is also a possibility that we may now be near an end in the current phase of globalization, given the fact that the Chinese has taken it one step further in flooding the world with their products along with my beliefs that the buying power of the average American consumer is now close to being exhausted.
Best of luck to our subscribers in the coming week!
Signing off,


