
This week's Chart of the Week video looks at the stock market's reaction to this past week's FOMC announcement.
So let's get technical!
"No warning can save people determined to grow suddenly rich" - Lord Overstone
 |
Gold •584 days | 2,368.70 | +35.30 | +1.51% |
|
Platinum •15 mins | 2,099.40 | +28.80 | +1.39% |
|
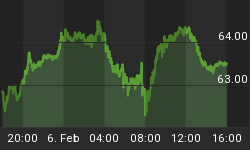
WTI Crude •20 hours | 63.55 | +0.26 | +0.41% |
|
Gasoline •20 hours | 1.953 | +0.027 | +1.38% |
|
Ethanol •584 days | 2.161 | +0.000 | +0.00% |
|
Silver •584 days | 30.82 | +1.16 | +3.92% |
 |
Silver • 584 days | 30.82 | +1.16 | +3.92% | |
|
Copper • 584 days | 4.530 | +0.111 | +2.51% | |
|
Brent Crude • 19 hours | 68.05 | +0.50 | +0.74% | |
|
Natural Gas • 20 hours | 3.422 | -0.087 | -2.48% | |
|
Heating Oil • 20 hours | 2.413 | +0.020 | +0.84% |

The Economic Community of West…

Wells Fargo has done it…

More freeports open around the…
This week's Chart of the Week video looks at the stock market's reaction to this past week's FOMC announcement.
So let's get technical!
Sign up to the


