• 920 days Will The ECB Continue To Hike Rates?
  • 920 days Forbes: Aramco Remains Largest Company In The Middle East
  • 922 days Caltech Scientists Succesfully Beam Back Solar Power From Space
  • 1,322 days Could Crypto Overtake Traditional Investment?
  • 1,327 days Americans Still Quitting Jobs At Record Pace
  • 1,329 days FinTech Startups Tapping VC Money for ‘Immigrant Banking’
  • 1,332 days Is The Dollar Too Strong?
  • 1,332 days Big Tech Disappoints Investors on Earnings Calls
  • 1,333 days Fear And Celebration On Twitter as Musk Takes The Reins
  • 1,335 days China Is Quietly Trying To Distance Itself From Russia
  • 1,335 days Tech and Internet Giants’ Earnings In Focus After Netflix’s Stinker
  • 1,339 days Crypto Investors Won Big In 2021
  • 1,339 days The ‘Metaverse’ Economy Could be Worth $13 Trillion By 2030
  • 1,340 days Food Prices Are Skyrocketing As Putin’s War Persists
  • 1,342 days Pentagon Resignations Illustrate Our ‘Commercial’ Defense Dilemma
  • 1,343 days US Banks Shrug off Nearly $15 Billion In Russian Write-Offs
  • 1,346 days Cannabis Stocks in Holding Pattern Despite Positive Momentum
  • 1,347 days Is Musk A Bastion Of Free Speech Or Will His Absolutist Stance Backfire?
  • 1,347 days Two ETFs That Could Hedge Against Extreme Market Volatility
  • 1,349 days Are NFTs About To Take Over Gaming?
How The Ultra-Wealthy Are Using Art To Dodge Taxes

How The Ultra-Wealthy Are Using Art To Dodge Taxes

More freeports open around the…

What's Behind The Global EV Sales Slowdown?

What's Behind The Global EV Sales Slowdown?

An economic slowdown in many…

  1. Home
  2. Markets
  3. Other

Intraday Elliott Wave Swings For USDJPY and AUDUSD

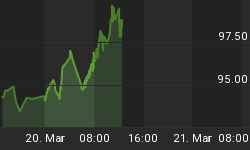
USDJPY has also been under pressure yesterday because of lower stocks. We have seen a reversal down from around 102.15 that now looks like a wave (e) of a big triangle. Firstly we thought it was wave (ii) but because of a ranged market since June 12 we believe that triangle is more appropriate labeling. We should keep an eye on 101.79 break that may put weakness in play for 101.58 and even lower after that.

USDJPY 1h Elliott Wave Analysis

USDJPY 1-Hour Elliott Wave Analysis Chart

Yesterday we presented a new wave count for AUDUSD that can be a flat formation with wave c) now heading down to 0.9300/0.9325. If that's a flat then we need five waves down in c), for now that's not the case yet, so be aware of more weakness in the next 24 hours.

AUDUSD 1h Elliott Wave Analysis

AUDUSD 1-Hour Elliott Wave Analysis Chart


Interested in our analysis? Get now 1 month of full service for just 1€. http://www.ew-forecast.com/service


Back to homepage

Leave a comment

Leave a comment