


A few weeks ago we reported the S&P 500 and Nasdaq posted their largest weekly declines since May 2012 and the Dow Jones Industrial Average turned negative for the year. Now there is a 180 degree turn as U.S. stocks closed out their best week in nearly two years on Friday, helped by earnings from Microsoft and Procter & Gamble and as concerns eased over the possible spread of Ebola in the United States. In the updated chart below the Russell 2000 index is the only laggard for the year as the Dow Jones Industrial index returned to positive territory.
The October 5th Weekly Setup opined ".... It is reasonable to expect the next few weeks will probably be similar to early April and July when price pullbacks were a prelude to a pickup in quarterly earnings announcements where investors bid stock prices back up..." This analysis appears to be playing out as predicted. The S&P 500 index was up 5.5 percent from its low on Oct. 15 and had its best weekly gain in nearly two years, boosted by solid corporate earnings reports. According to Thomson Reuters data through Friday morning, of 205 companies in the S&P 500 that have reported earnings, 69.8 percent have topped analysts' expectations, above the 63 percent rate since 1994. On the revenue side, 59.8 percent have beaten expectations, slightly below the 61 percent rate since 2002. If this trend continues and the Federal Reserve doesn't offer a surprise at their FMOC meeting this week stocks can be expected to continue climbing back toward recent highs.

Last week we noted "...The S&P 500 index had a strong bounce this past Friday, over next few days we should find out whether this is simply a 'head fake' with prices continuing downward. The S&P 500 needs to get back above its 200-day SMA to follow thru on Friday's move..." The updated chart shows the S&P 500 jumping back above its 200-day SMA to confirm the bullish move. Over the next week we should find out if the price bounce has 'legs' and continues back toward all-time highs or whether momentum slows and indexes trade range-bound.

Though the small cap Russell 2000 index is leading the stock market higher during the current bullish move, you can see in the chart below the index has not yet moved above its 200-day SMA. The larger cap Dow Jones Industrial and S&P 500 indexes had sank below their 200 day averages during the recent correction, but this week they returned above this level. We need to see the Russell 2000 follow the larger cap indexes above the 200-day SMA to deliver further confirmation the current bullish move will not reverse and head back lower.

We pointed out last week "... If stock prices follow thru on Friday's bounce expect treasuries to pull back from 52-week highs as investors use the funds to bid up equities..." The updated chart below shows treasury prices falling as investors pull money out to bid on stocks as confirmed by the S&P 500 surging last week. Obviously if the current move continues the S&P 500 line will cross above T-Bonds.

Market Outlook
According the Stock Trader's Almanac, next Wednesday, following a two-day meeting, the Fed will likely announce the end of quantitative easing (at least the current version of it). They will most likely continue to "reinvest" interest and principle payments from their massive portfolio of bonds so it will not be a cold turkey end and the Fed Funds rate will also likely remain where it is for some time. When the Fed ended previous QE programs the market did not respond well. It would seem only natural to assume a similar result is likely to occur this time as well. Perhaps, but more likely the market will continue to advance. For starters the US economy is on firmer footing now than all previous attempts. Just look at housing data, employment data, corporate earnings, etc. Yes it is not all perfectly rosy, but it is rather solid. Then there is the ECB, which is just firing up its printing presses again. They are looking to expand their balance sheet about 1 trillion euros through covered bond purchases. Some of these freshly minted euros are more than likely going to find their way across the Atlantic to U.S. markets with the largest effect being lower interest rates in Europe that will likely help hold down rates here. Low rates here and abroad should help finance even more stock buybacks and dividend increases leading to higher prices. At the start of the fourth-quarter, the best performing stocks continue to be 'risk-off' categories that benefit from low inflation and are considered 'safe bets' compared to investments that depend on high economic growth.

A standard chart that we use to help confirm the overall market trend is the Momentum Factor ETF (MTUM) chart. Momentum Factor ETF is an investment that seeks to track the investment results of an index composed of U.S. large- and mid-capitalization stocks exhibiting relatively higher price momentum. This type of momentum fund is considered a reliable proxy for the general stock market trend. We prefer to use the Heikin-Ashi format to display the Momentum Factor ETF. Heikin-Ashi charts are similar to the Japanese candlesticks charts you are used to seeing. Heikin-Ashi candlestick charts are designed to filter out volatility in an effort to better capture the true trend.
Take a look at last week's chart below as we said "... Until we get a bullish accumulation day (higher price on above average volume) and/or the downtrend line is broken expect prices to continue falling..." As circled in the updated chart below stocks are grossly oversold and this past Friday may be the start of an oversold bounce. The chart is flashing a technical bullish reversal signal; however at this point this is merely a 'countertrend bounce' until the reversal signal is confirmed..."

In the updated MTUM chart down below the oversold bounce is confirmed as we highlight several consecutive bullish accumulation days (higher prices on exceptionally higher volume). Bullish accumulation is considered a sign of large institutional money manager's participation in the rally. As noted, the chart is flashing a trend change from bearish to bullish momentum. It is reasonable to expect continued follow through on the current bullish move over the next week or so.

Recent commentary has discussed how "...the small cap Russell 2000 index led the large cap indexes lower during the current market pullback. This phenomenon also works in reverse as when the small cap index turns higher the other indexes usually follow suit. In the chart below notice how every time prices caved this year, the Russell 2000 recovered first and the market followed..." The updated chart below validates this analysis as you can see the small cap Russell 2000 index leading the market higher. Small caps relative strength is reflective of the United States superior performance compared to other world economies. The Russell 2000 index consist of the stock of domestic companies who are expected to benefit from a stronger U.S. economy compared to large cap indexes exposure to weaker global markets.

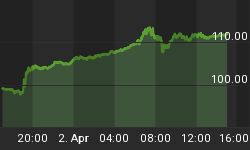
The one-week CBOE Volatility Index (VIX) graph below confirms investors' anxiety has eased considerably as the so called 'fear index' crashed as the S&P 500 index scored its biggest weekly gain in over a year. As long as we continue to hear positive quarterly earnings results expect the VIX to stabilize near the lower level of its recent range.

The American Association of Individual Investor Survey (AAII) survey continues to get more bullish. The bullish percentage is heading towards extreme levels where contrarians believe a price correction is eminent. Recently we have been discussing how individual investors appear to have latched on to long positions and riding out price pullbacks. For this strategy to pay off the market needs to return back towards all-time highs. It is a reasonable expectation for stocks to finish the year on strong note, but there will probably be some hiccups along the way as it would be extraordinary for the contrarian nature of the AAII survey not to pan out.

Second-quarter National Association of Active Investment Managers (NAAIM) exposure index averaged 81.64%, the third-quarter average dropped to 71.09%. Last week the NAAIM exposure index was 9.97%, and the current week's exposure is 41.38%. Last weeks' reading was the lowest in history of the index and money managers had to put money back into stocks when prices recovered. Money managers being underinvested was one of the reasons the S&P 500 had its largest weekly percentage gain in over year as they had to chase prices higher when the market bounced


Trading Strategy
As seen in the updated graph below, the hottest group of stocks over the past month is the Utilities sector. Utilities held up better than every other sector during the recent correction and we said they would be a leader when stocks recovered. Consumer Staples and Healthcare are the other sectors to look at as the market heads higher.

Regards,


