


The stock market jumped on Friday, pushing the Nasdaq to a 15-year high and helping the S&P 500 index snap three consecutive weeks of losses which followed a pullback in the dollar. Largely behind this week's gains was Wednesday's Federal Reserve statement, which signaled a less aggressive approach to raising interest rates than investors had expected. "The Federal Reserve's created a situation where there's very little alternative to equities, so the path of least resistance for stocks will be up for a period of time," said Robert Lutts, president, chief investment officer at Cabot Money Management in Salem, Massachusetts.
Last week, the Dow gained 2.1 percent while the S&P 500 rose 2.7 percent, both snapping a three-week run of losses. The Nasdaq ended up 3.2 percent. The Nasdaq ended just 22 points from its record closing high, while the S&P 500 ended less than 10 points below its record close.

Last week we said "...the Russell 2000 has diverged higher from the other major equity indexes...We want to see the other indexes catch up to the Russell to signal investors are buying the current dip..." The updated chart below shows the other major equity indexes following the Russell 2000 higher that confirms investors bought the dip.

A tool to help confirm the overall market trend is the Bullish Percent Index (BPI). The Bullish Index is a popular market "breadth" indicator used to gauge the internal strength/weakness of the market. It is the number of stocks in an index (or sector) that have point & figure buy signals relative to the total number of stocks that comprise the index (or sector). So essentially it is the percentage of stocks that have buy signals. Like many of the market internal indicators, it is used both to confirm a move in the market and as a non-confirmation and therefore divergence indication. If the market is strong and moving up, the BPI should also be moving higher as more and more stocks are purchased.
Last week's commentary opined "... investors' reaction to next week's Federal Reserve Open Market Committee meeting will determine whether the downtrend line is broken..." The Federal Reserve continues to capitulate to the stock market. Investors got the continued low interest rate environment they wanted to hear from the Fed and responded by breaking the downtrend and moving the market higher.

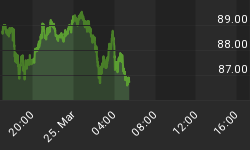
The U.S dollar maintains its inverse relationship to commodity assets. In the chart below you can the dollar's recent pullback corresponded to a bounce in treasury securities and precious metals. Last week the dollar was off 1.5 percent against a basket of major currencies.

Market Outlook
Last week we commented "...Market pundits are debating how soon the U.S. Federal Reserve will start raising interest rates; rate sensitive asset classes are going underwater..." The Federal Reserve Open Market Committee committed to near-term lower interest rates, which catapulted rate sensitive assets like real estate and treasury bonds. Nasdaq and Midcap shares continue to lead the market at they have all year.

A standard chart that we use to help confirm the overall market trend is the Momentum Factor ETF (MTUM) chart. Momentum Factor ETF is an investment that seeks to track the investment results of an index composed of U.S. large- and mid-capitalization stocks exhibiting relatively higher price momentum. This type of momentum fund is considered a reliable proxy for the general stock market trend. We prefer to use the Heikin-Ashi format to display the Momentum Factor ETF. Heikin-Ashi candlestick charts are designed to filter out volatility in an effort to better capture the true trend.
Recent Momentum Factor ETF (MTUM) chart analysis said, "...the downtrend is slowing down. Now the question is, is this just a pause before stocks head lower or will prices bounce higher..." In the chart below the answer is a prices bouncing higher. Don't be surprised if prices stall next week because stocks have become overbought.

In the updated chart below, the Volatility Index has sank back to the lowest level of the year as the S&P 500 index moves back toward all-time highs.

The current Put/Call ratio has gotten overly bullish. Traders are doing excessive call buying to bet on higher near-term stock prices

Last week's analysis proved to be accurate as we stated "...disproportionately neutral at the expense of the bullish number that has been shrinking the past four weeks. The current survey results support the current range-bound trading with daily triple-digit price moves..." The American Association of Individual Investors (AAII) Sentiment Survey remains a reliable contra-indicator. Individual investors are usually wrong about market direction. As investors recorded the lowest bullish reading of the year, the market responded by pushing stocks higher.


The National Association of Active Investment Managers (NAAIM) Exposure Index represents the average exposure to US Equity markets reported by association members. The green line shows the close of the S&P 500 Total Return Index on the survey date. The purple line depicts a two-week moving average of the NAAIM managers' responses. As the name indicates, the NAAIM Exposure Index provides insight into the actual adjustments active risk managers have made to client accounts over the past two weeks. Fourth-quarter NAAIM exposure index averaged 67.77%. Last week the NAAIM exposure index was 65.68%, and the current week's exposure is 67.77%. Institutional Investors current exposure remains near the lowest level of the year. Investors were anxious ahead of last week's Fed meeting and are sitting on cash.


Trading Strategy
Last weeks comments "...Don't be surprised if volatility soars higher next week as a reaction to the Federal Reserve meeting and announcement, plus there is quadruple witching at week's end..." The graphic below confirms Healthcare is far and away the leading S&P sector. Cyclicals are moving up strongly on improved economic domestic economic prospects. The financial sector is improving based on potential higher interest rates, which benefits financial companies. Materials and energy stocks are getting pounded as the worst performing groups.

Feel free to contact me with questions,


