


The three major indexes posted higher weekly performances for the sixth week in a row, after posting their best monthly results in four years in October. Economic reports generally have been positive, but many analysts are concerned about the probability of higher interest rates challenging the durability of the current rally. There is also a feeling that equities are due for a pause after climbing so far so fast. "We've come a long way and the market needs to take a breather while it digests the information," said Tom Cahill, portfolio strategist at Ventura Wealth Management. The major indexes had a modest advance this past week with the S&P rising .95%; Dow Jones Industrial Average up 1.40% while the Nasdaq advanced 1.85%.

A standard chart that we use to help confirm the overall market trend is the Momentum Factor ETF (MTUM) chart. Momentum Factor ETF is an investment that seeks to track the investment results of an index composed of U.S. large- and mid-capitalization stocks exhibiting relatively higher price momentum. This type of momentum fund is considered a reliable proxy for the general stock market trend. We prefer to use the Heikin-Ashi format to display the Momentum Factor ETF. Heikin-Ashi candlestick charts are designed to filter out volatility in an effort to better capture the true trend. The current chart signals a pending change in the market trend. As highlighted, indicators point to declining momentum while the trend has converted into a trading range. This supports our contention that the grossly overbought strength indicator needs to be resolved before the stocks move much higher.

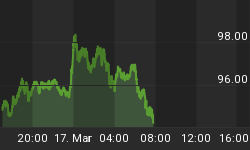
As seen in the chart below, the dollar is soaring as Gregori Volokhine, president of Meeschaert Capital Markets, said the increasing likelihood of higher US interest rates pushed the dollar up this week, a market move with broad implications for equities in the weeks ahead. "A strong dollar is not a guaranteed positive for everyone, especially energy producers and US exporters," Volokhine said. A positive jobs report sparked a selloff in Treasury Bonds, which sent short-term Treasury yields soaring, as it was taken by investors as an indication that the Federal Reserve had sufficient reason, based on the October jobs report, to raise interest rates in its December meeting. Treasury yields rise when prices fall and vice versa. On Friday Gold extended its losing streak to a seventh straight session, settling at the lowest level in more than three months after the jobs report made a December interest-rate rise look more likely.

Market Outlook
As reported by the Stock Trader's Almanac, the most recent five times (shaded in grey) when the S&P 500 was up 5% or more in October were followed by an average November-December gain of 5.04%. However taking a longer-term view paints a slightly less optimistic picture. Going back to 1930, and increasing the dataset to 16 occurrences, reveals an average November-December gain of just 0.34%. Narrowing the data range to 1950 to present and the average improves modestly to 2.48%.

So far the major equity indexes have finished higher every week in the fourth quarter. This is reflected in the quarterly performance results in the chart below. Conversely, you can see that interest-rate sensitive asset classes are suffering under the threat of higher interest rates.

The CBOE Volatility Index (VIX) is known as the market's "fear gauge" because it tracks the expected volatility priced into short-term S&P 500 Index options. When stocks stumble, the uptick in volatility and the demand for index put options tends to drive up the price of options premiums and sends VIX higher. As seen in the updated chart below, as the S&P trends higher the Volatility Index is sinking.

The American Association of Individual Investors (AAII) Sentiment Survey measures the percentage of individual investors who are bullish, bearish, and neutral on the stock market for the next six months; individuals are polled from the ranks of the AAII membership on a weekly basis. The current survey result is for the week ending 11/04/2015. The most recent AAII survey showed 39.00% are Bullish and 18.60% Bearish, while 42.40% of investors polled have a Neutral outlook for the market for the next six months. You can see retail investors' bullish percentage remains at historical norms and supports the contention that the market should keep trending higher.

The Nation Association of Active Investment Managers (NAAIM) Exposure Index represents the average exposure to US Equity markets reported by NAAIM members. The blue bars depict a two-week moving average of the NAAIM managers' responses. As the name indicates, the NAAIM Exposure Index provides insight into the actual adjustments active risk managers have made to client accounts over the past two weeks. The current survey result is for the week ending 11/04/2015. Third-quarter NAAIM exposure index averaged 56.15%. Last week the NAAIM exposure index was 56.71%, and the current week's exposure is 69.16%. Last week we commented "...as earnings season progresses expect money managers to keep putting idle funds to use in the stock market..." The updated NAAIM survey displays the increased equity exposure we expected. As money managers continue to liquidate bond positions, expect equity exposure to keep creeping higher.

In the chart below, the Aggregate Bond ETF (AGG) represents the "bond" market and the Equal-Weight S&P 500 ETF (RSP) is the stock market benchmark. As evidenced in the chart below, investors are selling off bonds in response to concerns about possible higher interest rates.

Trading Strategy
As evidenced in the graph below, the S&P Financial sector is coming on strong and a good bet going forward as financial institutions tend to benefit from higher borrowing rates. The rate-sensitive Utilities sector is the worst performing group in response to possible higher interest rates. Consumer Staples and Energy group are starting to lag with crude oil prices falling. "The market is reacting today as if rates will be increased in December," said Ben Halliburton, chief investment officer at Tradition Capital Management in Summit, New Jersey. "They're rotating money to take advantage of that or cut back where they're not going to be advantageous," Halliburton added. If recent history is a gauge, the smart move is to identify favored cyclical stocks to invest in at this time of year. You can see the Cyclical, Tech, Industrials and Materials have performed extremely well the past month.

Feel free to contact me with questions,


