


The good news is:
• In spite of a rough week for the market indices, the breadth indicators held up pretty well.
The Negatives
There are no serious negatives.
Considering how close some of the indices are to their all time highs, the number of issues hitting new highs should be higher.
The positives
While new highs have been disappointing, new lows have disappeared and nothing really bad will happen without a significant increase in new lows.
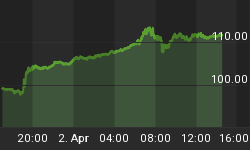
The chart below covers the past 6 months showing the NASDAQ composite (OTC) in blue and a 40% trend (4 day EMA) of NASDAQ new highs divided by new highs + new lows (OTC HL Ratio), in red. Dashed vertical lines have been drawn on the 1st trading day of each month. Dashed horizontal lines have been drawn at 10% levels for the indicator, the line is solid at the 50%, neutral level.
OTC HL Ratio held up better than the index last week.

The next chart below is similar to the one above except it shows the S&P 500 (SPX) in red and NY HL Ratio, in blue, has been calculated from NYSE data.
NY HL Ratio also held up better than the index and finished the week unchanged at a sensational 92%.

The chart below covers the past 6 months showing the OTC in blue and a 10% trend (19 day EMA) of NASDAQ new highs (OTC NH) in green.
This chart looks pretty good, especially because OTC NH rose last week while the index was falling.

The next chart is similar to the one above except it covers the past year.
OTC NH does not look as impressive here.

Seasonality
Next week includes the first 5 trading days of May during the 4th year of the Presidential Cycle.
OTC data covers the period from 1963 to 2015 while SPX data runs from 1928 to 2015. There are summaries for both the 4th year of the Presidential Cycle and all years combined.
Gains have been modest over all periods and a little weaker during the 4th year of the Presidential Cycle than the over all average.
Report for the first 5 trading days of May.
The number following the year represents its position in the Presidential Cycle.
The number following the daily return represents the day of the week;
1 = Monday, 2 = Tuesday etc.
| Break down by Presidential Years | ||||||
| OTC Presidential Year 4 | ||||||
| Day1 | Day2 | Day3 | Day4 | Day5 | Totals | |
| 1964-4 | -0.05% 5 | 0.85% 1 | -0.36% 2 | 0.59% 3 | 0.25% 4 | 1.28% |
| 1968-4 | 0.00% 3 | 0.60% 4 | 1.39% 5 | 0.09% 1 | 0.18% 2 | 2.26% |
| 1972-4 | -0.89% 1 | -0.63% 2 | -0.44% 3 | 0.12% 4 | 0.40% 5 | -1.45% |
| 1976-4 | -1.14% 1 | 0.21% 2 | 0.00% 3 | 0.20% 4 | 0.67% 5 | -0.06% |
| 1980-4 | -0.22% 4 | 0.41% 5 | 0.56% 1 | 0.84% 2 | 0.95% 3 | 2.54% |
| 1984-4 | 1.15% 2 | 1.09% 3 | -0.18% 4 | -0.66% 5 | 0.18% 1 | 1.58% |
| 1988-4 | 0.13% 1 | 0.66% 2 | -0.16% 3 | -0.55% 4 | -0.02% 5 | 0.05% |
| 1992-4 | -0.09% 5 | 0.93% 1 | 0.78% 2 | 0.22% 3 | -0.37% 4 | 1.46% |
| Avg | -0.04% | 0.66% | 0.20% | 0.01% | 0.28% | 1.12% |
| 1996-4 | 0.77% 3 | -1.78% 4 | 0.53% 5 | 0.14% 1 | -0.30% 2 | -0.64% |
| 2000-4 | 2.52% 1 | -4.36% 2 | -2.07% 3 | 0.35% 4 | 2.60% 5 | -0.96% |
| 2004-4 | 0.97% 1 | 0.61% 2 | 0.35% 3 | -1.00% 4 | -1.02% 5 | -0.10% |
| 2008-4 | 2.81% 4 | -0.15% 5 | -0.52% 1 | 0.78% 2 | -1.80% 3 | 1.12% |
| 2012-4 | 0.13% 2 | 0.31% 3 | -1.16% 4 | -2.25% 5 | 0.05% 1 | -2.92% |
| Avg | 1.44% | -1.08% | -0.57% | -0.39% | -0.10% | -0.70% |
| OTC summary for Presidential Year 4 1964 - 2012 | ||||||
| Averages | 0.47% | -0.10% | -0.10% | -0.09% | 0.13% | 0.32% |
| % Winners | 54% | 69% | 38% | 69% | 62% | 54% |
| MDD 5/3/2000 6.34% -- 5/4/2012 3.38% -- 5/7/2004 2.01% | ||||||
| OTC summary for all years 1963 - 2015 | ||||||
| Averages | 0.32% | 0.18% | 0.04% | -0.08% | -0.08% | 0.37% |
| % Winners | 63% | 70% | 60% | 55% | 55% | 62% |
| MDD 5/7/2010 9.33% -- 5/7/2002 6.78% -- 5/3/2000 6.34% | ||||||
| SPX Presidential Year 4 | ||||||
| Day1 | Day2 | Day3 | Day4 | Day5 | Totals | |
| 1928-4 | 0.15% 2 | 0.25% 3 | 0.50% 4 | 1.56% 5 | 0.84% 1 | 3.30% |
| 1932-4 | -1.54% 1 | -1.39% 2 | 1.41% 3 | -1.05% 4 | 7.22% 5 | 4.65% |
| 1936-4 | 0.73% 5 | -0.50% 6 | 0.14% 1 | 1.45% 2 | 1.14% 3 | 2.95% |
| 1940-4 | -1.31% 3 | 0.58% 4 | 0.17% 5 | -0.25% 6 | -0.25% 1 | -1.06% |
| 1944-4 | 0.76% 1 | -0.08% 2 | 0.67% 3 | -0.17% 4 | 0.58% 5 | 1.76% |
| 1948-4 | -0.26% 6 | 1.04% 1 | -0.06% 2 | -0.58% 3 | 0.84% 4 | 0.98% |
| 1952-4 | -0.64% 4 | 1.68% 5 | 0.13% 6 | 0.30% 1 | 0.04% 2 | 1.51% |
| Avg | -0.15% | 0.54% | 0.21% | 0.15% | 0.47% | 1.23% |
| 1956-4 | -0.45% 2 | 0.02% 3 | 0.35% 4 | 0.35% 5 | -0.60% 1 | -0.33% |
| 1960-4 | -0.44% 1 | 1.29% 2 | 0.38% 3 | -0.33% 4 | -0.20% 5 | 0.71% |
| 1964-4 | 0.89% 5 | 0.37% 1 | 0.51% 2 | 0.22% 3 | 0.11% 4 | 2.11% |
| 1968-4 | 0.39% 3 | 0.63% 4 | 0.07% 5 | -0.31% 1 | 0.56% 2 | 1.34% |
| 1972-4 | -0.91% 1 | -0.57% 2 | -0.08% 3 | 0.25% 4 | 0.36% 5 | -0.96% |
| Avg | -0.10% | 0.35% | 0.25% | 0.04% | 0.05% | 0.57% |
| 1976-4 | -0.71% 1 | 0.50% 2 | -0.53% 3 | 0.28% 4 | 0.71% 5 | 0.24% |
| 1980-4 | -0.78% 4 | 0.11% 5 | 0.76% 1 | -0.12% 2 | 0.88% 3 | 0.84% |
| 1984-4 | 1.02% 2 | 0.14% 3 | -0.43% 4 | -1.30% 5 | 0.23% 1 | -0.35% |
| 1988-4 | 0.09% 1 | 0.55% 2 | -1.02% 3 | -0.59% 4 | -0.51% 5 | -1.47% |
| 1992-4 | -0.58% 5 | 1.06% 1 | -0.02% 2 | -0.01% 3 | -0.23% 4 | 0.22% |
| Avg | -0.19% | 0.47% | -0.25% | -0.35% | 0.22% | -0.10% |
| 1996-4 | 0.06% 3 | -1.71% 4 | -0.27% 5 | -0.13% 1 | -0.40% 2 | -2.44% |
| 2000-4 | 1.09% 1 | -1.50% 2 | -2.16% 3 | -0.40% 4 | 1.65% 5 | -1.32% |
| 2004-4 | 0.92% 1 | 0.18% 2 | 0.18% 3 | -0.67% 4 | -1.37% 5 | -0.76% |
| 2008-4 | 1.71% 4 | 0.32% 5 | -0.45% 1 | 0.77% 2 | -1.81% 3 | 0.54% |
| 2012-4 | 0.57% 2 | -0.25% 3 | -0.77% 4 | -1.61% 5 | 0.04% 1 | -2.03% |
| Avg | 0.87% | -0.59% | -0.69% | -0.41% | -0.38% | -1.20% |
| SPX summary for Presidential Year 4 1928 - 2012 | ||||||
| Averages | 0.03% | 0.12% | -0.02% | -0.11% | 0.45% | 0.47% |
| % Winners | 55% | 68% | 55% | 36% | 64% | 59% |
| MDD 5/4/2000 4.01% -- 5/3/1932 2.92% -- 5/4/2012 2.61% | ||||||
| SPX summary for all years 1928 - 2015 | ||||||
| Averages | 0.11% | 0.17% | 0.20% | -0.06% | 0.14% | 0.56% |
| % Winners | 55% | 69% | 64% | 44% | 49% | 67% |
| MDD 5/3/1930 8.27% -- 5/7/2010 7.60% -- 5/4/2000 4.01% | ||||||
May
Since 1963, over all years, the OTC in May has been up 60% of the time with an average gain of 0.6%. During the 4th year of the Presidential Cycle May has been up 62% time with an average loss of -0.1%. The average return was pulled down by a 11.9% loss in 2000. The best May for the OTC was 1997 (+11.1%), the worst 1970 (-13.0%).
The average month has 21 trading days. The chart below has been calculated by averaging the daily percentage change of the OTC for each of the 1st 11 trading days and each of the last 10. In months when there were more than 21 trading days some of the days in the middle were not counted. In months when there were less than 21 trading days some of the days in the middle of the month were counted twice. Dashed vertical lines have been drawn after the 1st trading day and at 5 trading day intervals after that. The line is solid on the 11th trading day, the dividing point.
In the chart below the blue line shows the average of the OTC in May over all years since 1963 while the black line shows the average during the 4th year of the Presidential Cycle over the same period.

Since 1928 the SPX has been up 57% of the time in May with an average loss of -0.2%. During the 4th year of the Presidential Cycle the SPX has been up 68% of the time with an average loss of -1.5% (helped considerably by losses of 23.3% and 24.0% in 1932 and 1940 respectively). The best May for the SPX was 1933 (+15.9%) the worst 1940 (-24.0%). The SPX has not had a double digit % move, either way, in May since 1940.
The chart below is similar to the one above except it shows the daily average performance over all years for the SPX in May in red and the performance during the 4th year of the Presidential Cycle in black.

Since 1979 the Russell 2000 (R2K) has been up 65% of the time in May with an average gain of 1.3%. During the 4th year of the Presidential Cycle the R2K has been up 56% of the time with an average loss of -0.2%. The best May ever for the R2K, 1997 (+11.0%), the worst 2010 (-7.7%)
The chart below is similar to those above except it shows the daily performance over all years of the R2K in May in magenta and the performance during the 4th year of the Presidential Cycle in black.

Since 1885 the Dow Jones Industrial Average (DJIA) has been up 51% of the time in May with an average loss of -0.1%. During the 4th year of the Presidential Cycle the DJIA has been up 41% of the time in May with an average loss of -1.5%. The best May for the DJIA 1898 (+14.7%), the worst 1940 (-21.7%)
The chart below is similar to those above except it shows the daily performance over all years of the DJIA in May in grey and the performance during the 4th year of the Presidential Cycle in black.

Conclusion
Strength in the breadth indicators suggests the rally that began in mid February is not over.
I expect the major averages to be higher on Friday May 6 than they were on Friday April 29.
Last weeks positive forecast was a miss.
This report is free to anyone who wants it, so please tell your friends. They can sign up at: http://www.stockmarket-ta.com/signup.html. If it is not for you, reply with REMOVE in the subject line.
These reports are archived at: http://www.safehaven.com/
Good Luck,
YTD W 8 / L 8 / T 1


