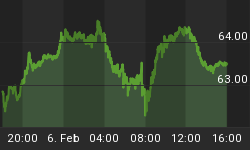
The chart below of the S&P 500 suggests a move down to around 2041/42 early Friday, June 24 or about 3% down from today's high near 2107. The e-wave astro/cycle pattern also suggests a strong move back up into Tuesday, June 28 to perhaps as high as 2121/22. By July 5th, a move into the low 1900's is possible.
Everybody is focusing on the BREXIT, so the outcome, whatever it will be, will likely be the blame for the coming volatility. We shall soon find out. It is 12:30 CDT as I write this. I still see new highs by October 3rd.
GDX is also following the shortened 4 and 8 TD cycles (4-1 and 8-2). It would not surprise me to see GDX gap up Friday into the 26.20's followed by a drop to 24.62/63. Next week should see GDX back above 27, IF I'm reading the waves correctly.
The masses of Irregular Tops (IT) and Bottoms (IB) since the April top should not have surprised me, as they seem to be ongoing. Today's IT is one example and it is one step higher degree in amplitude than the last mid 8 TD cycle top (TD 5) last Wednesday, suggesting a higher amplitude degree of moves going forward. Now we seem to be running 3 and 6 TD cycles instead of the usual 4 and 8 TD cycles.
Jupiter trines Pluto June 26, suggesting a top 2 TD's later, following the recent conversion to the 3/6 TD cycle from the 4/8. Looks like some crazy days ahead!
Brad Gudgeon, editor and author of the BluStar Market Timer, is a market veteran of over 30 years. The subscription website is www.blustarmarkettimer.info


