


An old rule on Wall Street is that two things drive stocks: corporate profit and interest rates. The fed's in a rate raising cycle, and the 3rd quarter 2005 corporate profit declined for the first time since 3rd quarter 2004 by $54.4 billion (Chart 1). The stock market hit a snag in late November. While the Fed keeps raising interest rates hoping to contain rising home and commodity prices, the principle of the "supply-side economics" is not to hurt corporate profits and definitely not to hurt the financial market.

Chart 1
Since mid November, $177.8 billions were added to the M3 money supply (Chart 2). The Fed did the same in May when the market appeared to be in BIG trouble. The Fed increased M3 six weeks in a row for a total of almost $150 billiion. That relentless supply of liquidity changed the course of the market. The Nasdaq went on to gain over 200 points from May to July. This is why we don't fight the Fed. We monitor money supply closely and we trade with the flow.
By all means, if the Fed keeps this up, eventually it's going to send us into a hyperinflationary recession. Everyone who saves now will be punished BIG time. But, before that catches up with the Fed's insanity, the market seems to be taking the steroid shots in stride. And, we can not pretend that we don't see what's happening.

Chart 2
I'm sure you don't need to see anymore S&P or Nasdaq charts from me or anyone to know this. The first 3 trading sessions of 2006 have really saved almost all technical indicators from falling apart. The market's put on quite a display of firepower. And that has prompted my Market Strength MACD to issue a BUY signal today (see Chart 3). However, as you can see this may not be as strong a buy signal as the one on October 25. The current blue bar's shorter than 10/25, and it's also shorter than yesterday's. The "suspect" buy signal on 10/5 also had shorter bar than the day before.
Therefore, as has been suggested by other readers, the trading action is usually taken the day after the buy or sell signals. Tomorrow, if the market fails to keep pace, the fast line (black line) will fall back below zero again. This will nullify this buy signal and turns it into another suspect. We'll see... I know this is so "un-technical", but I continue to "feel" quite uneasy about this market. Something's bugging me, and it may be the Retail Sector's divergence from the rest of the market.

Chart 3
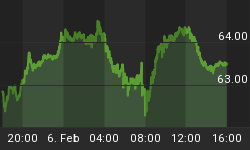
The Retail Holders has been in a clear downtrend since it made a lower high in mid December, in the midst of the Christmas shopping season (Chart 4). Today, it closed below the 95 support. Eventually, this divergence will have to be resolved. It's quite possible that the retail sector's leading the way down. Remember consumption represents 70.2% of our economy, and these are the customers that corporations need in order to generate profits.

Chart 4
Finally, the Nasdaq might've gone way ahead of itself. And that worries me, too. The Nasdaq TRIN Index has dropped from 2.01 on the last trading day of 2005 to 0.50, 0.50, and then 0.39 in the first three trading days of 2006. That to me is pendulum way over swung.
The Fed's big increase in money supply may be able to hold up the market for a while, but the bottom line is still our economy. When investors return to earth sometime in the next week or two, they'll realize nothing has changed for the better.


