

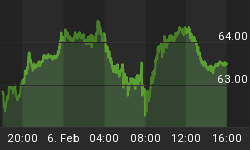


After nearly five weeks of getting relentlessly hammered and eviscerated, it was great to see the flagship HUI unhedged gold stock index stabilize a bit this week. The HUI managed to find some support near its 200-day moving average and gave battered gold stock investors and speculators a chance to catch their breaths.
With the HUI plunging 31% over 23 trading days between May 10th and June 13th, the short-term pain for those who rode it down has been intense. But as always in the markets, there is a silver lining. At least two major things have been accomplished by the HUI's sharp decline which will help this bull's ultimate longevity.
The most important is that sentiment is being rebalanced. The extreme greed rampant in early May is rapidly bleeding away and balance is being restored. Instead of only seeing folks wildly enthusiastic about gold stocks like six weeks ago, today a healthy cross section of optimism and pessimism is being reestablished.
Balanced sentiment enables a long and orderly march higher in a bull market. The longer a bull climbs in this normal fashion, the more mainstream investors it will ultimately attract. And the more capital that migrates into a bull due to its healthy behavior, the higher it will ultimately be driven before it eventually goes Stage Three parabolic and ends. This means vastly higher profits potential for the early contrarians.
The HUI's sharp decline has also crushed a dangerous falsehood. Six weeks ago all kinds of people in the gold stock community were advancing New-Era-type arguments claiming that the HUI did not need to correct despite its massive rise over the past year. These foolish claims were troubling because they hoodwinked a lot of naïve investors and speculators into buying gold stocks at very high prices in April and early May.
Before its sharp 31% slide the mere concept of the potential for a correction was widely ridiculed, as is often the case near major interim tops when euphoria trumps logic and prudent judgment based on market history. But now that the inevitable correction has arrived, no one attempts to argue that it was not a correction. This newfound agreement among virtually all gold stock traders that corrections happen offers a fantastic opportunity to study them.
Interestingly the recent slide in the HUI is the sixth major correction in its bull to date. These events are nothing new and need to be expected periodically after major uplegs give up their ghosts. Corrections should not be perceived as threats, but as wonderful opportunities. Corrections provide the best buying prices in powerful ongoing bulls for both investors and speculators to add new long positions.
Since corrections naturally follow uplegs, and the same emotions of greed and fear drive these cycles time and time again within a secular bull, corrections can be gamed. While studying bull-to-date history won't reveal exactly when corrections are coming or exactly how low they will go, it will illuminate the general seasons when corrections are most probable as well as the most likely levels for the resulting interim-low buying opportunities.
This first chart is the latest update of one we have used many times at Zeal throughout this gold stock bull. It is a secular rhythm chart of the HUI, showing the six major uplegs and six major corrections that have manifested themselves in this index since its bull market began. Understanding this chart is very valuable because it helps set expectations about what kinds of gains and losses are possible in the HUI based on precedent.

Including our latest awesome specimen, the six major uplegs of this gold stock bull so far have averaged incredible 104% gains over 156 trading days each. Hypothetically if all of these uplegs had been traded perfectly, which is admittedly impossible, a speculator could have increased his initial capital by over 64x since late 2000! Meanwhile a buy-and-hold investor, if perfectly timed, would be up 11x.
Now an 11x buy-and-hold gain since November 2000 is extraordinary by any standards. Nevertheless, the difference between the hypothetical 11x investor win and the hypothetical 64x speculator win is utterly enormous. This ought to give investors an idea of why speculators like me seek to actively trade this incredible HUI bull market. Even if a speculator only managed to capture half of the potential gains possible from trading the HUI, he would still be up 32x bull-to-date tripling the performance of the buy-and-hold investor.
Speculating on the big swings in the HUI is not an exercise designed to achieve merely marginally better gains than buying and holding, but to blast them out of the water like a nuclear-tipped torpedo. Trading is certainly a much riskier strategy than holding, but the potential rewards vastly outweigh the additional risks for those who have the risk capital, disposition, and risk tolerance necessary to actively speculate.
As you study the major uplegs above, one attribute in particular really sticks out. The scale and magnitude of the major HUI uplegs has alternated since 2002. First a massive upleg will launch, more than doubling the HUI in a short period of time running from six months to a year. After these massive uplegs, big corrections arrive to bleed off the excessively bullish sentiment. But then the next uplegs after these corrections tend to be rather anemic with much smaller gains than the massive uplegs. I call these consolidation uplegs.
I have been studying this phenomenon for a couple years now and find it quite fascinating. There has to be some underlying reason why massive uplegs are typically followed by consolidation uplegs. The leading theory in my mind has to do with speculator psychology surrounding major new bull-to-date highs in the HUI.
During a massive upleg like the one we just witnessed, the HUI rockets higher as more and more capital floods into gold stocks. Naturally this makes the HUI soar, threatening to shoot vertical at the end of these massive uplegs. Including our latest specimen that just failed in May, these massive uplegs have averaged amazing 136% gains over just 183 trading days, or nine months. Obviously riding these is the mother lode for gold stock speculators.
But after a massive upleg finally reaches its apex when no new buyers can be enticed in, the inevitable sentiment-balancing correction arrives. The correction bleeds off the greed and paves the way for the next upleg, but so far that next upleg has been a comparably anemic consolidation upleg. In these consolidation uplegs the HUI advances far enough to challenge its highs from the previous massive upleg but it doesn't exceed them. Why?
The massive uplegs are so immense that they drive the HUI up to dazzling new bull-to-date highs. When these highs are first reached at massive-upleg apexes, they seem foreign and a bit scary. Massive upleg 2 above saw the HUI highs blast from 75ish to 150ish. Massive upleg 4 put 250 on the map. And the latest massive upleg 6 carried us just shy of 400. Just as it took some time to see 150 as normal back in summer 2002 it will take some time now for gold stock speculators to view 400 as reasonable.
The way new highs that seem incredible now become widely accepted as a new base is via a long sideways consolidation. The longer a price trades near a new high, or at least well above the previous widely accepted high, the more comfortable traders will become with it. The consolidation uplegs after the massive uplegs serve this purpose, they trade sideways and establish new normality for much higher highs.
As a consolidation upleg nears the levels where the previous massive upleg topped, some speculators start selling as they perceive the old highs as major resistance. This selling feeds on itself and initiates corrections, carving a second top near the levels of the previous massive upleg. While smaller, the consolidation uplegs are very important because they build confidence and create the foundation for the next massive upleg.
Obviously since we have just had a massive upleg this pattern suggests a consolidation upleg is in the cards for major upleg 7. If this pattern holds true, this next upleg would top somewhere around 400ish. This would help establish a strong base near 400 for the next massive upleg, the HUI's eighth. Of course the problem with pattern analysis is that patterns can break at any time, and this one may very well already be over.
With the gold bull that drives the HUI now in Stage Two, anything is possible. In gold, Stage Two is the time when global investors start chasing gold so the amount of capital seeking to buy gold balloons tremendously. If mainstream stock investors follow gold's lead and start buying the gold stocks with ever increasing capital inflows, this may short-circuit the alternating massive-consolidation upleg pattern of Stage One.
Either way upleg 7 plays out is fine. If it is a consolidation upleg we will be ready for it since our expectations for it are much more modest than for a massive upleg. Understanding that a lesser upleg is probable will mitigate the psychological pain felt if the HUI tops near 400ish next time around. But if upleg 7 bucks the pattern and proves to be massive again since Stage Two is here, then our positions will just ride it higher until their trailing stops are triggered in the eventual correction that ends the upleg. Be ready for either outcome.
While I am excited about the upcoming upleg 7, at the moment I am much more interested in correction 6. After plunging 31% in 23 days do the bull-to-date probabilities suggest we are out of the woods yet? Interestingly, if we average the five major HUI corrections before this one, they had an average loss of 30% over 88 trading days. Since we are already down 31% now, we have already exceeded the magnitude metric of 30%. This suggests it is highly likely that the worst of this correction is already behind us.
But not surprisingly the corrections after massive uplegs tend to be bigger than those after consolidation uplegs. Corrections are often somewhat symmetrical with their preceding uplegs. After massive uplegs 2 and 4, the HUI corrected 36% and 34% respectively. This averages out to 35% over 73 trading days. So if correction 6 follows the post-massive-upleg correction precedent, then we probably have a little farther down to go yet. A 35% HUI correction off the early May highs would drag this index down to 255ish.
While the probabilities suggest that thankfully the worst is behind us this time around in depth terms, this correction nevertheless remains very young in time terms. The HUI only fell for 23 days so far as of its latest bounce on June 13th. If we run this correction out to today in duration terms, it is still only 29 days old. This compares to 88 days on average for all the major HUI corrections and 73 days on average for post-massive-upleg corrections. Either way the duration so far looks very young.
Remember that the purpose of corrections is not only to remove euphoria from prices, but from sentiment. The longer a correction takes to run its course, the more sentiment damage is done. I have seen this time and time again in this gold stock bull. If the HUI is still trading near today's levels or a little lower two months from now, I guarantee there will be a lot more disappointment, fear, and even despair than there is today. Time is a necessary element for a correction to gradually bleed away over-exuberant sentiment.
Since massive uplegs 2, 4, and 6 and their resulting corrections have so much in common, I wanted to see them all in common terms. So I indexed each one individually, making the interim low ahead of each massive upleg 0 and the interim high at the apex of each upleg 100. This approach makes it much easier to compare them in duration terms, to see how they were tactically ebbing and flowing relative to their peers at any given time.
I didn't know how this exercise would turn out, but this chart ended up being pretty interesting. The three massive HUI uplegs are charted in individually indexed terms on the left axis. The horizontal axis is denominated in days. Day 0 is each upleg's apex, so negative days lead up to it during uplegs and positive days represent the resulting corrections. Naturally these are trading days, not calendar days, just as in most market analysis.

You have to admit the massive HUI upleg 6 that just ended felt enormous, so I was surprised to find out that it was the slowest massive upleg yet. It took the HUI 248 trading days to rise 137%. This is still a staggering gain in less than a year, but it was at a much slower pace than the two massive uplegs before it. Upleg 6 was also unique in that it had an initial interim top followed by a multi-month proto-correction. I discussed this development in more detail in our current monthly newsletter.
Other than these key differences, the upleg patterns carved by these three massive uplegs look similar in duration terms. In each case the uplegs started fairly gradually when few believed in them and sentiment was still rotten from the preceding corrections. Then they started accelerating higher at a more rapid pace in the middle as more investors and speculators started believing in them and hence throwing capital at them.
Their final surges didn't happen until the last 40 trading days or so, exciting periods of time when 40% to 60% of the total gains of the entire massive uplegs accrued. These final surges led to near vertical price movements each time which highlighted how overbought the HUI was becoming and how desperately a correction was needed to restore sentiment balance. These corrections came in three separate ways.
Upleg 2, which had the shortest correction, consolidated for about 28 days after its top but then it promptly fell off a cliff. This brutal plunge was the sharpest HUI correction by far of this entire bull. This correction was also unique in that it was virtually uninterrupted, it was a literal plunge straight down. It certainly makes the correction 6 that we have been watching in recent weeks seem mild by comparison.
Upleg 4, which had the longest correction, initially ground slowly lower off the tops while consolidating. The HUI didn't really start plunging until about 83 days into this correction. Once the plunge phase started it didn't last too long, but it sure did a lot of damage to stock prices and sentiment. This particular deceptive and delayed correction happened in April and early May 2004. It caught most folks off guard.
For you rHUI aficionados, the HUI actually hit its 200dma in April 2004 on the first of these three legs down, near 70 indexed. Yet it continued plunging under 0.80x relative! This severe 2004 breach of the HUI's 200dma, along with another one in 2005 that also fell under 0.80x relative, is the reason why we cannot necessarily rely on the HUI's 200dma to hold as support today. The HUI has not bounced right near its 200dma for several years.
I was amazed when I noticed where corrections 2 and 4 ended in indexed terms, 38.3 and 38.2 respectively. This means that both these corrections, even though they were quite different in duration and profile, both ended at the same level. Once they plunged low enough so 61.8% of the preceding massive uplegs' gains were wiped out, they ended and major interim lows were carved. These events also marked some of the best buying opportunities of this entire bull.
Now you veteran traders instantly recognized these were classic Fibonacci retracements. Leonardo Fibonacci was a renowned Italian mathematician from the early 13th century. His most famous contribution to world knowledge was his Fibonacci series, which he figured out while pondering the dynamics of rabbit breeding of all things! A Fibonacci series runs 1, 1, 2, 3, 5, 8, 13, 21, 34, etc, where each new number in this sequence is derived by adding the two numbers before it. The ratio between these numbers is 0.618.
If you divide 21 by 34, for example, you get 0.618. This 0.618 number is also familiar from the 1.618 Golden Ratio, which has been used for millennia by both nature and elite artists to make shapes very aesthetically pleasing to the human eye. Proportions in the golden ratio are found all over the biological, as well as classical, worlds. This Fibonacci number is very important in nature and art, and in the financial markets.
If you divide a number in the Fibonacci series by the sum of itself and the next number, such as 21 by 21+34, you get 0.382, which is also 1 minus 0.618. After endless studies of the markets many traders believe that financial markets tend to have an affinity for 38.2% and 61.8% retracements and movements. These numbers definitely exist more often in the markets than they should by random chance, so there may be some subtle psychological considerations that lead traders to make decisions that yield Fibonacci numbers in price charts.
It is really fascinating that both of the post-massive-upleg HUI corrections before this latest ended at nearly identical Fibonacci levels of 38.2 on an indexed scale! In light of this strong precedent, we at least ought to acknowledge the possibility that the HUI will retrace 61.8% of its latest massive upleg and its correction will end near 38.2 indexed. So where is this in actual HUI terms today? 255ish!
As you may recall from above, HUI 255 is also where a 35% correction in the index would carry us, and the 35% is the average decline of corrections 2 and 4 after massive uplegs 2 and 4. While the HUI certainly does not have to follow precedent and anything could happen, I would not bet against seeing these numbers again sooner or later. The degree of symmetry inherent in the rhythms of secular bulls is quite remarkable and it seems to hold together much more often than it fails.
In light of these observations, I drew a probable consolidation range in this chart. Since the HUI fell so hard so fast this time around, thankfully the vast majority of its correction in percentage terms is probably behind us. Yet in the time-duration terms crucial to rebalance sentiment, it remains very young. I suspect the odds favor it meandering generally sideways to lower in a consolidation in the coming months. Upside potential is low but downside risk isn't extreme either since multiple technical approaches point to a 255ish probable bottom.
When this bottom arrives, extraordinary buying opportunities will exist in the world's best unhedged gold stocks. We have been diligently preparing for this all year at Zeal. We recently published a report detailing the fundamentals of our 20 favorite gold stocks today. We undertook extensive fundamental research to whittle down hundreds of gold stocks to our 20 favorites so we are good to go when the next great buying opportunity comes to pass.
When the technical probabilities for success again look very favorable, we will be launching a new gold stock and silver stock campaign in our newsletters in the months ahead. We hope to redeploy into the best stocks near the best technical times to add positions. Please subscribe today so you don't miss the enormous opportunities surrounding the coming sixth major interim low of this entire bull market!
The bottom line is the HUI is in a major correction today, which is totally normal, healthy, and expected after the massive upleg we enjoyed over the past year. These corrections, over an entire bull market, tend to establish rhythms which can then be gamed by investors and speculators.
While no two corrections are identical, often their averages are similar so they can help us understand the probabilities governing their depth and duration. While these odds suggest that we aren't out of the woods yet this time around in duration terms, thankfully the worst is almost certainly behind us in depth terms.


