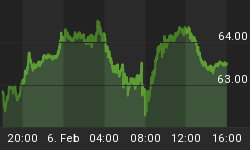
Gold started the year at $515 per ounce. Gold peaked at $725/oz on May 12th. The gold ETF (GLD) started the year with 8.5 million ounces in its vaults. On the day of gold's peak, GLD had 11.4 million ounces. Gold has since tumbled $145/oz in 6 weeks, but curiously the assets of GLD have been rising as of late. In fact, GLD yesterday reached a new record high of ounces in the trust with over 11.7 million ounces.
The same trend of "a declining metal price, but increased ETF assets" can be seen in the silver ETF (SLV). Silver started the year at $8.85/oz. It subsequently rose 70% to $15/oz, before correcting by $5.50 to near $9.50 an ounce. The silver ETF began life on April 28th with silver at $12.55/oz. The silver ETF reached a peak of 73 million ounces in its vaults around the time physical prices peaked. With the aforementioned sell-off, silver ETF assets declined to 67 million ounces, but have since begun heading back upwards to a near peak level of 72-73 million ounces in the trust.
The continued accumulation of gold and silver ounces in the ETFs likely means that savvy individual and institutional investors (who are driven by fundamentals) are eagerly accumulating the metals after their sharp pull back - a bullish sign. At the same time, the price has been weak in all likelihood because leveraged black-box technical types at CTAs and hedge funds are liquidating. One could argue that gold and silver prices declining in spite of the ETFs building up ounces is a bearish sign; we, however, believe that ETF asset accumulation is evidence that long-term fundamental investors are flocking back to the metals in anticipation of a continuation of their multi-year bull market resuming. When the black-box precious metal selling by funds is over, we should again see gold and silver moving higher as the U.S. Dollar is shunned by global investors who realize the Fed has exhausted its ability to raise rates given that the residential real estate market in the U.S. is rolling over. Our June 2006 issue goes into detail about the housing market falling apart, so be sure to subscribe for more insight.


