


Enthusiasm for gold continues to dry up. Trading volume this past week was one of the lowest for some time. Where, oh where are those speculators when you need them???
GOLD
LONG TERM

We don't really seem to be going anywhere lately with the price of gold. It seems to have settled into a lateral trend, one where we can draw all sorts of trend lines or support and resistance levels, depending upon the chart we use. I had expected a lateral trend and expect that it will still continue for a while. Where to from here? Well I still think it has much lower level before it bottoms and goes into a new major up move. My intuition tells me to expect the final lows to be reached sometimes near the end of the year. However, as always, I let the market action tell me where it's going and just go with the flow, whichever way that is.
The long term P&F chart is not telling us anything different from the message of the past few weeks so we'll dispense with it this week.
The long term weekly chart shown suggests we are trapped in a major triangular pattern. We had seen a shorter term triangle over the past weeks that had been nullified by a downside break but this chart shows a longer term development. Which way is this pattern expected to break? Let's just wait for it to happen. The interesting part about this chart is if the price should continue lower, will it end up resting on that upper red support trend line or will it go back to the lower channel up trend line? With a P&F projection to the $480 level it seems like the likely move would be towards that lower line. For now we are still above a positively sloping moving average line and still inside the positive zone with the price momentum (RSI). Although both look like they could be broken soon it is just as likely that at the moving average line and neutral momentum line, support could be found to set up another good upside move.
One can set up a variety of scenarios as to what is expected to happen in the future. I'll just go with what is happening right now and that is still a NEUTRAL long term position, taking into account the bearish P&F along with the bullish normal indicators.
INTERMEDIATE TERM

Last week we were very close to finally breaking below the P&F up trend line dating back to the start of the bull several years ago. The slight rally kept us above the line for another week. How long it will stay there remains to be seen but a move to $610 will break below the line and $600 will break below the next support. The price action has stayed above this line for so long it would be a shame to see the trend broken, maybe it wouldn't be, we'll just have to wait and see. If broken THAT would be a serious message that more downside would still ahead.
The usual indicators are remaining almost as they were last week. The price keeps oscillating above and below the moving average line while everything moves basically sideways. Momentum is still very slightly above its neutral line for a positive reading but it is so precarious that one day's action could put this momentum into the negative. As for the volume indicator, unfortunately I have shown the long term moving average with the volume indicator, which shows the indicator still above the moving average line. Unfortunately, for the intermediate term the indicator has dropped below its moving average line and continues to drift lower. The action during the week changed very little of the technical position so we'll go on to the short term for a better look at the action.
Intermediate term wise I may have jumped the gun last week in going bearish. I'm back to NEUTRAL until the indicators give a firmer message.
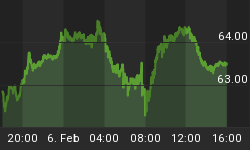
SHORT TERM
We had a great day on Monday but the rest of the week was kind of blah. The lateral trend continues but we now have a decelerating bearish FAN Principle at work. The break below the FAN number 2 (shown last week as the triangle up trend line) was a bear signal while a break below the third FAN trend line, this latest one, would confirm the bear.

The price action ended the week slightly below a negatively sloping short term moving average line. The price might have been a few $ lower but I had changed the contract month on Monday and therefore the action was more bullish than in reality, versus the Friday close. Although the bounce on Monday was from a level just slightly higher than the previous low in mid-July the strength indicator (the RSI momentum indicator) suggested weaker strength, lower than the strength in mid-July. It remains in its negative zone. As for the daily volume action, it hasn't been this consistently low for a long time. Except for a couple of weeks in July, the very low volume action is now ending its third month. We need those professional speculators back into the game or else the game collapses.
Despite what looks like a continuing lateral trend I see much lower levels ahead. On the short term there are two prices to watch. A move below $610 for a bear move or a move above $639 for a bull move.
IMMEDIATE TERM
The zig-zag continues. Even scalpers are probably having a rough time making a few bucks. Although the price is just a hair above a slightly positive moving average line the trend seems to be towards the down side the last few days. Although it has been rallying most of the week the Stochastic Oscillator is still in its negative zone and seems to have turned back to the down side. The two suggest that the next couple of days may continue on the down side. Should the price break that third FAN trend line, watch out below.
NORTH AMERICAN GOLD INDICES
Well, which Index is it to be this week? It looks like the next in line is the PHLX Gold/Silver Sector Index, commonly referred to as the XAU for its ticker symbol. We still have that potential head and shoulder pattern mention the last time we looked in on this Index. The right shoulder is getting a little elongated versus the left shoulder but this does not detract from the pattern. We now have on the right side what is often referred to as an ascending triangle where the upper part is horizontal while the lower part slopes upward. The conventional wisdom is that this type of triangular pattern is a bullish pattern with the break being made on the up side. I'll wait for it to happen. Traders might also wait for the actual break rather than assuming that the conventional wisdom is correct. There is no such thing as 100% perfection. Wait for a close at or above 151.0

MERV'S PRECIOUS METALS INDICES
A not so bad week for the Merv's Indices. Most had gains of 3.0% give or take a few 0.10 % points. The weighting method of calculating Indices worked for the North American majors as they were up an extra percentage point. Looking at the Composite Index of Precious Metals Indices we still have an upward sloping wedge pattern in formation. This pattern is most likely to break on the down side so watch out for a bearish move. If I took all the various chart patterns that I can find on the various gold Indices I'll find both bullish and bearish patterns. Which should one use? If gold moves, most of the gold Indices will move in unison so some of these patterns are bound to be right and some are bound to be wrong. That's why I let the daily and weekly market trading activity set the pace and I just go where it takes me, bullish or bearish.
Lumping some 20 Precious Metal Indices along with a couple of metals and one currency into one Composite Index gives one an overview of what the composite market is up to. So far this Composite Index is still BULLISH on the long term and has just gone back to the BULLISH side on the intermediate term. However, the intermediate term is still iffy and could use some better strength in its actions. Even long term, the price is not far above its long term moving average and it wouldn't take much for the moving average info to go negative. This period where it looks like the market wants to reverse direction and head back into the upper reaches of the charts is always a period of nail biting. One never is quite sure which way the market is about to go. It's not like during a roaring bull or bear market when the direction is well established. We are at the stage of possibly establishing a direction but are not yet well established.
MERV'S GOLD & SILVER 160 INDEX
The Composite Index of Precious Metals Indices gives us a feeling as to what a composite of stock Indices, precious metal indices and currencies are doing. The Merv's Gold & Silver 160 Index gives us a feel for what the world of precious metal stocks are doing. It covers the complete gambit of stocks from the highest "quality" to some of the lowest gambling variety. The three sector Indices further concentrates the stocks so that we can then assess more localized sectors.
It's interesting that, where all three sectors, from the highest quality to the gambling stocks, had performances during the week in the 3% area the overall 160 universe only gained 2.2% on the week. That suggests that the winning stocks during the week were represented in these sector Indices while most of the losers were not represented in these Indices. One of the major losers, at least by the stock price, was Wolfden Res. Which declined by 39.7% on the week and it was not in any of the sector Indices. However, this decline seems to be more of a reaction to ADDITIONAL distribution of shares to shareholders, thereby diluting the price of an individual share but increasing its numbers to compensate. This distribution was not accounted for by any adjustment in price.
While on the topic of major movers there were two other stocks in my arbitrary category of plus or minus 30% movers on the week. Vedron Gold, a very low priced "penny" stock gained 50% on the week. Check the Stock Review - Technically Speaking in this week's subscriber's section for a technical review of this stock.
The other stock in this category was also last week's winner, Bravo Venture Group with a 44.3% gain, on top of last week's 35.4% gain. Bravo is now ahead 119% since being recommended as a gamble a few short weeks ago at $0.58 (see chart in last week's commentary).
On a week that had seen some good moves in the various gold Indices it was somewhat disappointing that only 58% of the universe of 160 were winners while 32% were losers on the week. One might have expected a better individual performance. As for the overall individual ratings, in all three time periods the ratings improved just a little. For the short and intermediate term the rating moved from a barely negative to a neutral rating with neither bull nor bear in control. As for the long term the bear is still in control but with a slightly lower percentage, at 54%.
As for the charts and indicators, they are POS for both the intermediate and long term, but only barely so. Although the Index closed higher on the week it is still below its level of a few weeks back so more upside work needs to be done here.
MERV'S QUAL-GOLD INDEX
MERV'S SPEC-GOLD INDEX
MERV'S GAMB-GOLD INDEX
All three sector Indices had advances greater than 3% during the week. The ratings in the table have now all gone POS or + NEUTRAL for all three time periods. More than three quarters of the stocks in the Qual and Spec sectors had gains on the week. The Gamb stocks were a different story. Although the Gamb Index had a gain of 3.4% on the week less than half of the component stocks had gains. Most were losers. The performance was primarily due to 6 of the component stocks having double digit gains with Bravo at 44.3% (see above). Despite this weaker showing the Gamb-Gold Index was the only Merv's Index that has now moved decisively above its recent highs to make a new rally high. It is, however, still some distance from its all time high so we'll have to wait for that one.
Looking at the charts there was really little change in the indicators and charts from last week except for slightly more positive movements. This is the same for the overall ratings of the component stocks. The short term ratings can be quite volatile and are really of little note but the other time periods are important to watch. These all improved a little during the week and except for the long term Spec and Gold ratings, are either neutral or POS. The Spec and Gold long term ratings are still very slightly NEG.
From time to time I include an updated chart of one of my Merv's Indices in these commentaries. I thought I'd do something just a little bit different this week and include instead the table of technical information and ratings for one of my Indices. Subscribers get similar tables, on a weekly basis, to that shown here for the overall universe of 160 stocks as well as for each of the sector and silver Indices. The table shown below is that for the Merv's Qual-Gold Index. There is, of course, a tutorial for subscribers so that they can get the maximum benefit from these tables.

Click to open larger image in new window
SILVER
Silver remains trapped in the up trending channel shown in last week's commentary. It gained a little this week but nothing to get all excited about. The up trend is so weak, however, that its longevity is in doubt from here. The momentum, although positive, is moving in an almost horizontal direction as the price inches higher. This could have the effect of pulling the price lower. The next week or two should tell us if this is to be or if the action starts to gain strength instead of just being neutral.

MERV'S QUAL-SILVER INDEX
The Qual-Silver Index had an okay week with 8 of its 10 component stocks gaining ground and only 2 losing. It is, however, still slightly below its previous rally high set just a few weeks back. Another good week and we will be into new rally highs. Both the intermediate and long term can be classified as being BULLISH although the long term overall stock rating is still stuck in NEUTRAL.
MERV'S SPEC-SILVER INDEX
One of the hardest hit of Merv's Indices recently, the Spec-Silver Index gained 2.8% on the week but with only 58% of its component stocks on the rise with 28% on the decline. The long term is still mired in the NEG rating category while the intermediate term is stuck in NEUTRAL. Looking at the charts the long term can be rated as BULLISH while the intermediate term can only be rated as NEUTRAL, at best. Still more work required here.
MERV'S PRECIOUS METALS INDICES TABLE

Click to open larger image in new window
Well. I think I'll close for this week.


