


Weekly Trader Alert #72
Overview
This was the best September in years, with rises in the major indexes anywhere from 4% to close to over 5%. Taking a step back from reporting on what happened last week, we see that for months, money has been rotating from various alternative investments into the US stock market. As it became apparent the Fed would pause and that inflation concerns may be reduced with falling energy and commodity prices, the stock market has continue to rise.
We still have the concern over a lack of clear leadership. The week to week pattern has been with a relatively large move up in one week, with a small pull back the next week. The uptrend has never been broken, but this has been accomplished not through leadership from specific identifiable leaders that can sustain such as position, but rather, from energy and gold, at one time, and now the retailers. Money has been moved away from risk to defensive positions, and there seems to be a bet, made by big money that the proverbial soft landing, a.k.a. the Goldilocks Economy will be accomplished.
This is a wonderful scenario, if it unfolds, and we are all for it, as it can result in a sustained bull market that could last through 2007. We remain concerned, however, in the lack of leadership, and the defensive positioning of most investors.
The trend to rotate from commodities continues to provide liquidity into the markets, but that money is no longer finding itself moving into tech, except for large cap tech, like Intel (INTC), Microsoft (MSFT), and Cisco (CSCO). Small caps continue to trail large and mid-caps. With so much risk avoidance, it is hard to see this rally lasting through 2007.
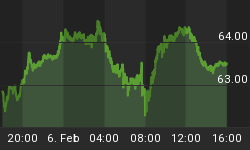
Oil prices have hovered in the $63 range for three days. Natural Gas leapt from a close of $4.20 on Wednesday to a close of $5.62 on Friday, with a huge gap up on Thursday. That is a 30% jump in the price of natural gas in two days.
Economic reports show a drop in consumer spending, but a rise in consumer confidence. The Philly Fed shows a drop in manufacturing activity, while Chicago is seeing a rise in manufacturing. Core inflation is expected to drop, but has shown its greatest rise on a twelve month basis, in the last month. For every bull out there trumpeting the Goldilocks economy, there is a bear saying that we are headed for a hard landing, primarily on a blow up in the housing market affecting consumer spending, and of course the threat that oil prices will increase again in the near future, and that a conflict in the Middle East or terrorist incident is likely.
We are trying to be balanced, but have a decidedly pessimistic edge, leaning toward a problem with the housing market. Although there was an increase in new home sales, exisiting home sales have declined. Both have seen price drops across the nation, with more exaggerated drops on the Coasts and in hot markets like Las Vegas. With savings rate continuing to be negative, Americans are spending more than they are taking in. That means they are getting the money from somewhere which is a draw down in their net worth. They can be financing purchases on credit cards, taking more money out of their homes, depleting their savings, or selling their investments. Anyway you look at it, this is likely to end badly at some point, or earnings have to rise sufficiently to compensate for the negative savings.
We are still concerned over rising food prices, which has made investments in companies in those industries a winning trade. Lower energy prices can reduce some costs to those industries, but that won't lessen the burden on consumers, as there is a real food shortage brewing.
What are we looking for the market to do in the near future? Given that a lot of money has flowed in from foreign markets, and non-equity markets, such as the commodities markets and real estate investments, the market could maintain its rise seen since the summer. However, the markets have been in a rising wedge pattern that has narrowed considerably. It will break out of this pattern, and the most likely direction is down, so we will either see a correction and a resumption of this uptrend, or we will see the beginning of a more serious downtrend. Either of these should be tradable, and we will position for either event.
To understand more, we will have to look at the charts.
Market Climate
The market continues to progress in its uptrend. However, price tested its upper boundaries this week and pulled back later in the week.
A chart of the composite of over 8,000 stocks traded on the U.S. Stock markets continues to be included.
The U.S. stock market composite chart:

Either the resistance level just above will be broken, or price will move down to re-test the 200-day moving average. The Bollinger Band is narrowing, with the upper Band moving sideways and the lower band rushing up to meet it. A break out is likely in the short term. With the 200-day and the 20-day moving average lying just below, and the 50-day moving average coincident with the bottom uptrend line, there is significant support just below. This argues that the uptrend could continue. However, a break down through the lower uptrend line, and therefore the 50-day moving average would be quite bearish, and would likely mark the start of a new downtrend.
The MACD continues to vascillate in a sideways pattern, but the most important aspect to the chart is the continued bearish divergence between price and RSI. This is usually resolved with a collapse of the market, which we are positioned for.
Continue to watch for the 50-day moving average to be breached. That is the sign that a new downtrend is in play and a short position will be well rewarded.
A look at the chart for the Dow Industrials is represented by the Diamonds ETF (Amex:DIA).

Abbreviations and color key appears below:
Note the following order is Red, Yellow, Green, just like a stop light, so it might be a helpful mnemonic:
Thick Red line represents the 200-day simple Moving Average (200DMA),
The yellow line represents the 50-day simple Moving Average, (50DMA)
The green line represents the 20-day simple Moving Average, (20DMA)
The light blue line represents the 3-day Moving Average, moved forward three days in time, (3x3MA)
The thick blue line indicates the exponential 13-day Moving Average (13DMA)
Bollinger Bands are abbreviated as BB. There is an upper and a lower Bollinger Band that varies in distance from a central moving average (shown as light red/pink) based on the volatility of stock price movements.
RSI stands for Relative Strength Index. It is an oscillator, which can be used to determine how overbought or oversold a stock may be.
Last week's start of a downtrend was foiled by the start of a new uptrend, which has been the bi-weekly pattern. That same pattern argues for the week forward to be a down one. The chart is somewhat self explanatory, in that the candlesticks argue for a new move downward to get started. Each of these moves has been halted at the uptrend line, which lies at around $115.50 on Monday, but may only reach around $116 if the downturn takes until mid-week. We will have to watch the trading as price nears this important boundary.
The S&P 500 ETF, known as the Spyders (AMEX:SPY) is shown in the chart below:

Wednesday and Thursday's tweezer top formation indicated the uptrend was out of steam. These same candles also formed a Harami indicating the uptrend was over. The bearish engulfing on Friday indicates a high probability of a downtrend. The lower boundary is around $132 on the next trading day moving up slightly through the week. Still
We look for a continued move to the downside, at least to the lower uptrend line.
This week's NASDAQ 100 ETF (QQQQ) Chart is below:

The expected downtrend didn't emerge from last week. It appears that an even better trade set-up exists to see downside in the immediate future, but each pull back has failed to break the support of the uptrend line. A turnaround at that support level would argue that the uptrend will continue.
Fundamental Trends
Three retailers are now in the top five, along with two other repeats from last week. So, investors seem to be betting on the consumer. That isn't necessarily a bad bet, with gasoline prices dropping. However, the consumer actually reduced spending last month, to a -0.1% level, inflation adjusted. If retailers continue to hold their leadership position, then the sentiment is for a soft landing and a Goldilocks economy.
The Industry leaders (ranked 1st-5th out of 190) are:

Industry laggards have shuffled around a bit, but remain largely unchanged. Gold and Silver Mining lied just above the laggards in in 184th place. Just above that lies the industry that supplies their equipment. Essentially, this is an anti-commodities group, anti-energy, anti-gold, anti-steel, etc. The speculators have dumped them. Part of this is likely related to Amaranth, the hedge fund that blew up. They have stated their losses at $6B and are going to liquidate their positions. We are certain there are many untold ripples affecting other funds, but they are quietly meeting their obligations, but that trade did a lot of damage in the market to speculator caught on the wrong side of those trades.
The Industry laggards (ranked 186th-190th out of 190) are:

Trade Recommendations
We are going to wait for clarity in the markets before making another trade recommendation. That clarity could come as early as Tuesday, so stay tuned.
On a related note, 20-Year Bonds (Amex:TLT) appear to have put in a top last week. These can probably be safely traded short here, but we had just put on four new trades, so we will wait to see if we get a good entry point.
Current Portfolio
FDG has been improving, even as its industry continues to be a cellar dweller. The ETFs that we shorted moved against us this week. As you have noted the up/down pattern on a week to week basis has repeated this week, if the pattern holds, next week will be a down week, which bodes well for these trades. We will exit these positions if we see another bounce by the middle of next week. We are looking for a broken trend or a bounce following the rising wedge. A break of the rising wedge should make these trades quite profitable, but that isn't likely to occur before next Tuesday.
We raised the stop on SA. SA is at a critical resistance point, which it touched on Friday. That price level is around $12.65. It will either break through that point, or it will turn over. The stop is set sufficiently below current price to allow for a pull back for another try.
FDG's dividend payment will be credited to your accounts on the 13th of next month. In U.S. dollars, it will be $0.72 ($0.80 Canadian). That is reflected in the adjusted entry price.

Generally, our model uses set stop prices to control risk. Index ETFs, including DIA, SPY, QQQQ, and IWM are managed somewhat differently, in that trades will be reversed to time the market, as opposed to using a set stop limit.
Unlike the majority of position trades in the fundamental trader, our ETF trades may see us exit positions prior to specific profit goals being achieved, as we are more concerned with positioning for the correct direction of the market more than with achieving a specific profit level. The reason for this is the profits come over time with a fair number of exchanges for long and short trades.
* Initial stop prices are set to cause us to exit our positions if they close below these levels. You will note they are generally kept pretty tightly the opposite side of the trades we initiate. Historic volatility would imply that intraday price action may trade outside of these values, so that condition is insufficient to cause an exit from an existing position. On significant movement beyond our stop prices, we may issue an intraday message to exit the position or to maintain the position. You may chose to implement an absolute stop below these suggested stop values, but that stop should be wide enough to take care of the daily volatility for the stock in question. You can examine the candlesticks for an idea of intraday price fluctuations.
Entry prices are adjusted to account for dividends paid. The stock price was adjusted by your broker, to reflect the dividend taken out. The non-adjusted entry price reflects the actual entry price, without the adjustment for dividend values.
LVPB Concept: The concept is a Light Volume Pull Back, where a stock's price will pull back to a support level on light volume. Obviously, heavy selling is a sign of weakness, and we would not want to buy on a heavy volume pullback. However, we will occasionally place stocks on the LVPB (Light Volume Pullback List) to indicate a "re-entry" buying opportunity, when we have already entered a position. This should be used to add to existing positions, or to enter a position if you missed the initial entry.
LVPB Portfolio Stocks:
Conclusions
There is a lot of confusion over where the economy is going in. With so many conflicting signs, investors seem to be avoiding risk, and rather piling into whatever seems to working at the moment, and defensive names. Retailers are currently hot, but are notoriously volatile.
We believe the rising wedge patterns of all the major indexes are likely to be broken soon. When this occurs, a new downtrend should get underway. Until then, betting against the trend should be contained to short term trading and those trades closed at the uptrend boundaries on a reversal.
A move to the upside in the energy markets is likely to dislodge this uptrend. So could any number of negative events. Companies have, for the most part, neglected to warn of earnings shortfalls, and a number of companies have raised guidance, which has allowed for rising earnings projections for the market overall and has sustained this uptrend. We will have to watch the unfolding of earnings season, which tends to provide a boost for the markets. This year, however, has tended to be a year in which betting against conventional wisdom has paid of handily for traders.
We currently expect a sell-off to get underway shortly, but the markets could have one more push upward left. After follow-through weakness on Monday, it will be important to watch Tuesday's trading to see if the bulls can get one more rally underway.
For those of you who have enjoyed your subscriptions to the Fundamental Trader and who would like to get additional savings off the price of your subscription, you may consider an annual subscription to the service. You can save nearly 20% off of the monthly rate by selecting the annual subscription price. Just click on the link below:
http://www.stockbarometer.com/pagesMFT/learnmore.aspx
Regards and Good Trading,


