


Weekly Trader Alert #81
12/4/2006 8:44:30 AM
Overview
There has been a see-saw of underlying sentiment which seems to be correlated to economic numbers being reported. A quick recap of those reports follows:
Friday's economic news has shown contraction in a couple areas of the economy. The ISM index declined to 49.5%, with anything under 50 showing contraction. This is the first time we have seen a contraction in manufacturing in three years. In addition, construction spending fell by 1.0%, led by a 1.7% decline in residential construction with a 0.7% drop in non-residential construction. These are both signs of contraction and would argue that the soft landing may not be soft enough, prompting the Fed to have to reduce interest rates. Of course the problem here is that the Fed also has to combat inflation, which could cause the Fed to have to raise rates.
Thursday's unemployment report saw unemployment claims rose to 357,000 which is the second weekly rise. The Fed is looking for an unemployment rise to reduce inflationary pressures, through lower pressures on wage growth and reduced consumer spending.
Wednesday's news was significantly more positive, with consumer spending for Oct and early November being up and Q3 GDP growth coming in at 2.2% annually, versus and expected 1.8%, following a 1.6% annual rate from Q2.
Tuesday's news was all about a 8.3% decline in durable good orders, which is the largest decline in six years. Core capital goods (showing business investment) fell for the first time in six months. This has started conjecture that GDP growth may be even less than the current estimate of 2.0% for 2007. Existing home sales were reported on the rise, for the first time since February, providing support for a soft landing scenario.
Monday was all about getting out of the way as the market sold off in conjunction with a bottom of implied volatility, measured by the VIX and VXN. The week actually showed a pick up in new home sales, but a decline in the price for those homes, which doesn't reflect the incentives bundled with them. In addition, new home sales don't reflect delivery of new homes, but rather only the signing of contracts. With record numbers of contracts being cancelled, the actual number of new homes is virtually certain to be declining, even with price reductions and incentives. Will the housing market act as a sufficient drag on the economy to allow it to have a soft landing or will the landing be a hard one?
Next week will report on employment numbers. The soft landing scenario will be supported with a modest number of additional layoffs. A large scale number would reduce inflation expectations, and allow the Fed to put off a need to increase interest rates, but it would also raise the likelihood of a hard landing. With contractions in housing and manufacturing, these are early warnings of a possible recession.
Fed Fund Futures now price in nearly a 100% chance of a Fed rate cut to 5.0% next March. This follows the economic reports today showing that parts of the economy are contracting.
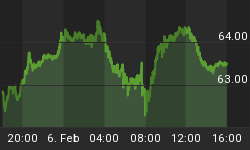
Oil and natural gas closed up significantly from a week ago, with oil at a closing price ($63.43) not seen since September. Natural Gas closed at $8.42, up significantly from last week.
Overall, we see rising energy prices and a contracting economy. With unemployment rising, this will decrease inflationary pressures, but with energy prices rising, this may not be enough. The Fed, while concerned about inflation levels higher than 2% (their comfort is for 1% annual inflation or less), will need to lower rates to stimulate the economy soon, in order to stave off the collapse in housing, as well as the evident contraction in the manufacturing sector.
To understand more about our view on the markets, we will have to look at the charts.
Market Climate
The broad market appears to have put in a local top last week, in conjunction with the low VIX and VXN, as well as extreme readings on some overbought indicators.
A chart of the composite of over 8,000 stocks traded on the U.S. Stock markets continues to be included.
The U.S. stock market composite chart:

Price has narrowed to trade between the upper and lower Bollinger Bands and is currently supported by the 20-day moving average. A break downward from here would suggest continued downside. The last two days have seen the heaviest trading volume of the past five months indicating a major move is likely brewing.
Now, let's take a look at the charts for the major indexes.
A look at the chart for the Dow Industrials is represented by the Diamonds ETF (Amex:DIA).

Abbreviations and color key appears below:
Note the following order is Red, Yellow, Green, just like a stop light, so it might be a helpful mnemonic:
Thick Red line represents the 200-day simple Moving Average (200DMA),
The yellow line represents the 50-day simple Moving Average, (50DMA)
The green line represents the 20-day simple Moving Average, (20DMA)
The light blue line represents the 3-day Moving Average, moved forward three days in time, (3x3MA)
The thick blue line indicates the exponential 13-day Moving Average (13DMA)
Bollinger Bands are abbreviated as BB. There is an upper and a lower Bollinger Band that varies in distance from a central moving average (shown as light red/pink) based on the volatility of stock price movements.
RSI stands for Relative Strength Index. It is an oscillator, which can be used to determine how overbought or oversold a stock may be.
The predicted move down in the DIAmonds occurred for the most part on Monday. Since then, the DIAmonds have regained lost ground, but haven't recouped all the losses yet. They broke initial support to test the bottom of the uptrend channel twice last week.
The hanging man candle put in on Friday is begging for confirmation. A further downside move on Monday will confirm that candle as a top and we would then expect further downside action to get under way. The key price area to watch is the $120.70 level. A strong move below that will break support and the bears will be in charge.
A look at the weekly chart for the Dow Industrials is represented by the Diamonds ETF (Amex:DIA).

Last week we noted that the DIAmonds showed a high probability Harami pattern that needed confirmation. It received it and now further downside is indicated.
The S&P 500 ETF, known as the Spyders (AMEX:SPY) is shown in the chart below:

Resistance continues to contain the SPYders. Last week, the SPYders fell below their 20-day moving average on Monday, but have since rallied back above this important support level. The pattern would have been an evening star, except for the strong rally in the final two hours. That rally is cause to believe the bulls may not be done with the uptrend move. However, the candle left on Friday is a hanging man. With confirmation, this is a bearish reversal candle, that would suggest downside ahead.
The weekly S&P 500 ETF, known as the Spyders (AMEX:SPY) is shown in the chart below:

We have seen confirmation of the bearish candlestick pattern seen over the last two weeks. This should cause further downside action, or at least constrain upside action.
This week's NASDAQ 100 ETF (QQQQ) Chart is below:

The QQQQs reversed sharply on Monday and have been leading the market downward. The revised uptrend support line hasn't yet been broken, but a rally is needed now or that line will be broken.
This weekly NASDAQ 100 ETF (QQQQ) Chart is below:

We have suggested that support will be around the $43 level. This is where the QQQQs found support, so the upcoming week becomes an important battleground, where the bulls will be able to continue the uptrend, or the bears gain advantage and downside action will heat up.
Fundamental Trends
It's all about Steel and Oil. While the two steel industries remain, they are now joined by three new leaders, all in Petroleum. Last week, there were three petroleum industries in the top screen (top 31 companies), now there are five. Two retailers remain in the top screen (department stores and auto parts).
There is a single apparel industry (shoes) in 18th place). Both mining industries are in the top screen, gold/silver mining and other mining. The three building industries (concrete, heavy construction, and residential/commercial builders), remain in the top screen this week. Yes, those are the same companies that overbuilt the housing market and aren't likely to see a turnaround until some time next year at the earliest. It is interesting that they continue to be in demand, even with all the poor news on new and existing home sales. The commercial side seems stronger, but it isn't as large as the home side of the business.
A couple of auto and truck industries occupy the top screen as do toys, chemical fertilizers, and Internet Networking. Real Estate management also enjoys a top screen spot as do airlines.
The most interesting departure was the staffing industry. With unemployment growing, staffing has fallen from its attractive status.
We continue to look for a bargain in the oil space. We may have missed our entry and will have to be patient.
The Industry leaders (ranked 1st-5th out of 190) are:

There are two additions to the laggards. The first, Mortgage Services, is no surprise whatsoever with the housing market in a quagmire and long term interest rates at their highest levels in years. The second, Internet Software has gone little noticed, but has been falling for some time.
The Industry laggards (ranked 186th-190th out of 190) are:

Trade Recommendations
We didn't make a trade recommendation intraweek, as the market weakened, strengthened then weakened. As it turns out, the overall trend was down for the week, and we had suggested that a short trade was in order.
We are continuing to monitor CNE for a possible trade entry. We would like to see a further dip in the price to afford a good entry.
Current Portfolio
Note: The model was forced to exit SWKS, but for those of you who stayed with the trade, you have been rewarded as it has move up to resistance, at around $7.21. It closed three cents higher than that on Thursday, but fell back on Friday.
FDG continues to strengthen as the market has been selling off and it has moved above its 20-day moving average. We believe that it should improve further from here.
Generally, our model uses set stop prices to control risk. Index ETFs, including DIA, SPY, QQQQ, and IWM are managed somewhat differently, in that trades will be reversed to time the market, as opposed to using a set stop limit.
Unlike the majority of position trades in the fundamental trader, our ETF trades may see us exit positions prior to specific profit goals being achieved, as we are more concerned with positioning for the correct direction of the market more than with achieving a specific profit level. The reason for this is the profits come over time with a fair number of exchanges for long and short trades.
* Initial stop prices are set to cause us to exit our positions if they close below these levels. You will note they are generally kept pretty tightly the opposite side of the trades we initiate. Historic volatility would imply that intraday price action may trade outside of these values, so that condition is insufficient to cause an exit from an existing position. On significant movement beyond our stop prices, we may issue an intraday message to exit the position or to maintain the position. You may chose to implement an absolute stop below these suggested stop values, but that stop should be wide enough to take care of the daily volatility for the stock in question. You can examine the candlesticks for an idea of intraday price fluctuations.
Entry prices are adjusted to account for dividends paid. The stock price was adjusted by your broker, to reflect the dividend taken out. The non-adjusted entry price reflects the actual entry price, without the adjustment for dividend values.
LVPB Concept: The concept is a Light Volume Pull Back, where a stock's price will pull back to a support level on light volume. Obviously, heavy selling is a sign of weakness, and we would not want to buy on a heavy volume pullback. However, we will occasionally place stocks on the LVPB (Light Volume Pullback List) to indicate a "re-entry" buying opportunity, when we have already entered a position. This should be used to add to existing positions, or to enter a position if you missed the initial entry.
LVPB Portfolio Stocks:
Conclusions
Last week's price movements, and fundamentals, showing contraction in the manufacturing and housing sectors are cause for concern that the uptrend move is getting tired, if it isn't over. The question is, what will happen with liquidity, with money able to move into equities from the piles of cash controlled by fund managers, money coming in from a possible top in bonds, and a weakening dollar causing angst among foreign investors.
For those of you who have enjoyed your subscriptions to the Fundamental Trader and who would like to get additional savings off the price of your subscription, you may consider an annual subscription to the service. You can save nearly 20% off of the monthly rate by selecting the annual subscription price. Just click on the link below:
http://www.stockbarometer.com/pagesMFT/learnmore.aspx.
Regards and Good Trading,


