• 1,050 days Will The ECB Continue To Hike Rates?
  • 1,050 days Forbes: Aramco Remains Largest Company In The Middle East
  • 1,052 days Caltech Scientists Succesfully Beam Back Solar Power From Space
  • 1,452 days Could Crypto Overtake Traditional Investment?
  • 1,457 days Americans Still Quitting Jobs At Record Pace
  • 1,458 days FinTech Startups Tapping VC Money for ‘Immigrant Banking’
  • 1,462 days Is The Dollar Too Strong?
  • 1,462 days Big Tech Disappoints Investors on Earnings Calls
  • 1,463 days Fear And Celebration On Twitter as Musk Takes The Reins
  • 1,464 days China Is Quietly Trying To Distance Itself From Russia
  • 1,465 days Tech and Internet Giants’ Earnings In Focus After Netflix’s Stinker
  • 1,469 days Crypto Investors Won Big In 2021
  • 1,469 days The ‘Metaverse’ Economy Could be Worth $13 Trillion By 2030
  • 1,470 days Food Prices Are Skyrocketing As Putin’s War Persists
  • 1,472 days Pentagon Resignations Illustrate Our ‘Commercial’ Defense Dilemma
  • 1,472 days US Banks Shrug off Nearly $15 Billion In Russian Write-Offs
  • 1,476 days Cannabis Stocks in Holding Pattern Despite Positive Momentum
  • 1,477 days Is Musk A Bastion Of Free Speech Or Will His Absolutist Stance Backfire?
  • 1,477 days Two ETFs That Could Hedge Against Extreme Market Volatility
  • 1,479 days Are NFTs About To Take Over Gaming?
Billionaires Are Pushing Art To New Limits

Billionaires Are Pushing Art To New Limits

Welcome to Art Basel: The…

What's Behind The Global EV Sales Slowdown?

What's Behind The Global EV Sales Slowdown?

An economic slowdown in many…

How The Ultra-Wealthy Are Using Art To Dodge Taxes

How The Ultra-Wealthy Are Using Art To Dodge Taxes

More freeports open around the…

  1. Home
  2. Markets
  3. Other

Charts and Commentary

Institutional Update:

Over 50% of all the market buying and selling comes from what the Institutional investors do.

That makes them a critically important element in where market trends are going, and when they end.

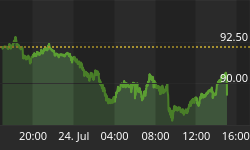
Below is an updated chart showing the trend of the "core holdings" that Institutions hold.

Currently, the price action is showing a topping process. The Institutional graph below is showing that their core holdings have shifted through 3 deteriorating channels which is typically part of a topping process.

Note the difference between the first channel and the current channel. The first had a long ascent with small pull backs in a tight channel. Currently, this 3rd. channel is wider with larger pull backs and a greater degree of volatility.

Each channel is producing a channel top that is only slightly higher than the previous channel top. This indicates that there is less upside potential with greater downside risk developing. This gives us a risk/reward equation that is unsatisfactory for conservative investors.

Yesterday, the Institutional Index remained in its third channel and above the Channel's support. Notice the sharp 3 day down movement when the second channel was broken. This is typical of weaker 2nd channels. This third channel should also show the same kind of market down movement when the channel breaks.

Please Note: We do not issue Buy or Sell timing recommendations on these Free daily update pages. I hope you understand, that in fairness, our Buy/Sell recommendations and advanced market Models are only available to our paid subscribers on a password required basis. Membership information


Back to homepage

Leave a comment

Leave a comment